
The deflation of Sydney’s housing market rolls on, with values falling another 0.09% in the week ended 3 May, according to CoreLogic:
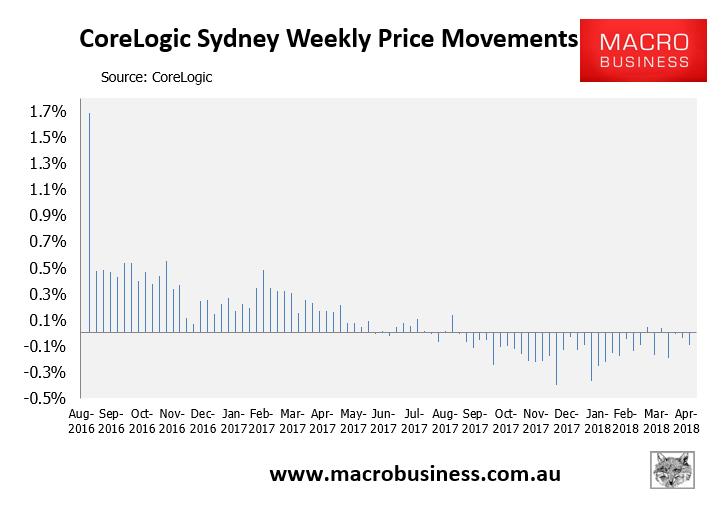
Sydney home values have now declined by a cumulative 4.5% over the past 34-weeks, with values also down 4.4% over the past 39 weeks.
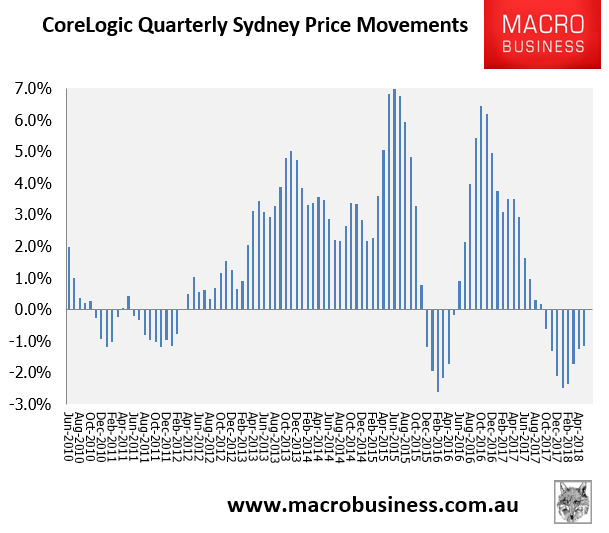
Sydney’s quarterly growth rate remains firmly negative, down 1.2% according to CoreLogic:
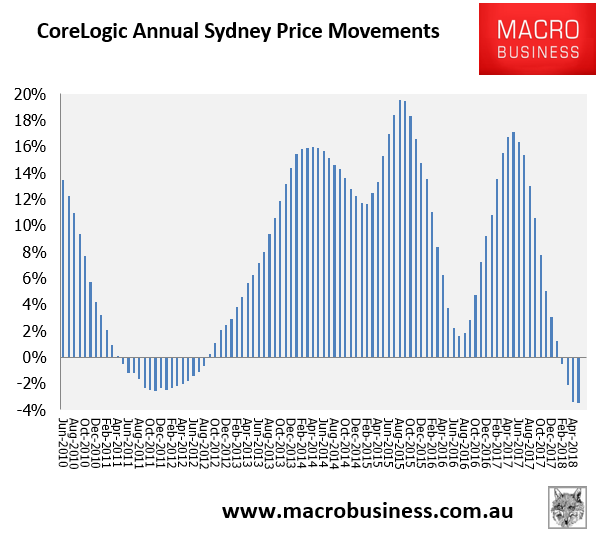
Whereas Sydney’s annual values losses are now 3.5% – the biggest annual decline since April 2009:
The immediate outlook is also soft with Sydney’s final auction clearance rate below 60% last week – way below the 74% recorded at the same time last year:
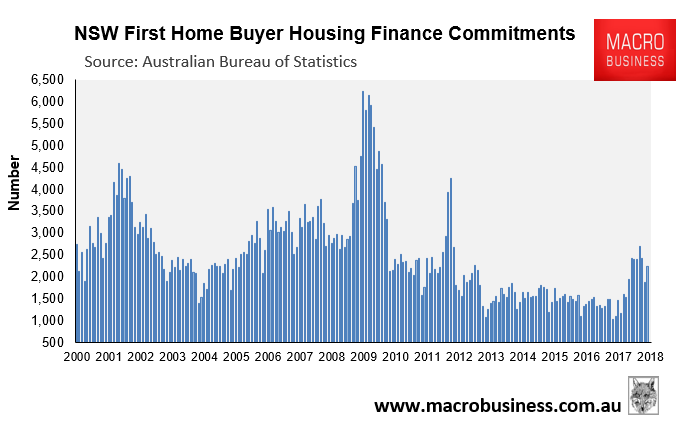
The weakness in Sydney’s dwelling prices also comes despite first home buyer (FHB) stamp duty concessions, introduced on 1 July 2017, which drove a 103% increase in FHB finance commitments in the year to February (latest available):
Indeed, CoreLogic’s tiered hedonic index shows that the top third of properties in Sydney (“High Value”) have fallen hardest – down 6.2% in the year to April – whereas the lowest third of properties (“Low Value”) have held up well, rising by 0.5% over the year:
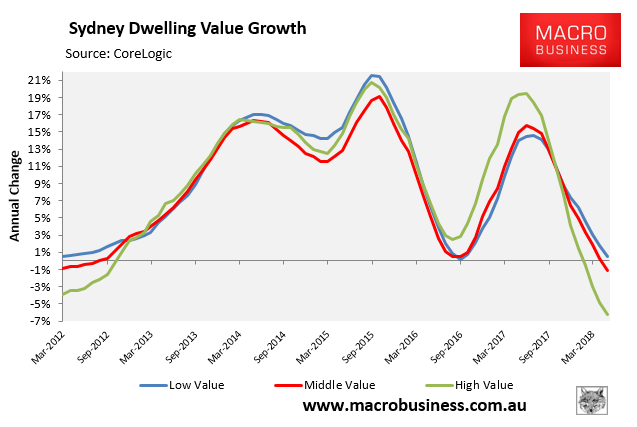
All price tiers, however, are clearly on a downward trend.
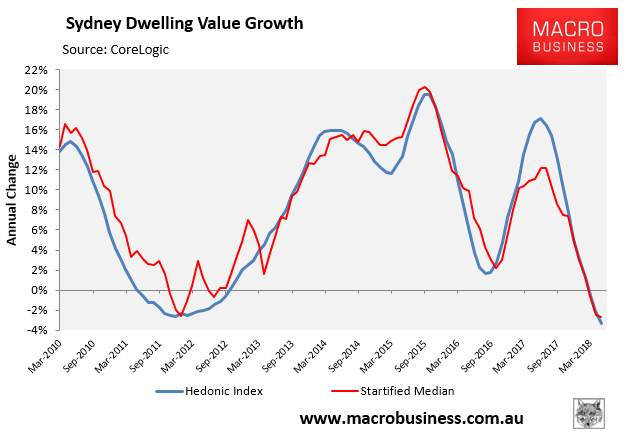
Finally, CoreLogic’s monthly stratified median is also reporting similar annual declines in Sydney price growth, down 2.7% in the year to April:
Sydney’s housing correction would be much worse without the FHB ‘sugar hit’.
