By Gareth Aird, Senior Economist at CBA:
Key Points:
- Wages growth has yet to lift despite the labour market slowly tightening.
- The RBA puts the NAIRU (non-accelerating inflation rate of unemployment) at 5.0%.
- There are good reasons to believe that it may be lower than the RBA’s estimate which means that a material lift in wages growth might still, unfortunately, be a long way off.
- A lower NAIRU would mean that a rate hike is further away, all else equal.
Overview:
The good news is that Australia’s labour market has gradually tightened over the past few years. The bad news for workers is that despite the tightening, wages growth has not yet lifted. There are a few reasons for this, but the primary one is that there is plenty of spare capacity in the labour market which reduces the ability of employees to negotiate pay rises.
As the unemployment rate moves lower wages growth could be expected to lift. But the level of unemployment below which wages growth will materially rise remains an unanswered question. The NAIRU – or non-accelerating inflation rate of unemployment – is broadly speaking, that level. It is the benchmark for assessing the degree of spare capacity and inflationary pressures in the labour market.
The RBA estimates the NAIRU to be currently 5% in Australia. On the surface, that looks about right. But after thinking about it a little more we think that it could be lower for two reasons: (i) the gap between rates of unemployment and underemployment are significantly higher now than four years ago; and (ii) it is probably harder for workers to negotiate pay rises because growth in the supply of labour is strong (i.e. skills shortages are not manifesting themselves for a sufficient period of time to allow workers to push for higher pay). Neither of these factors are captured in the RBA’s modelling. Lending support to the notion of a NAIRU below 5% is the current state of the NSW labour market. The unemployment rate in NSW has been at 4¾% for the past year and yet wages growth has not lifted.
If the NAIRU is indeed lower than 5% then unfortunately it means that a meaningful increase in wages growth is still some way off. Ultimately we won’t know where the NAIRU is until we get there. But if the RBA is wrong then the NAIRU is almost certainly going to be lower than 5% not above it.
Latest trends in wages and unemployment
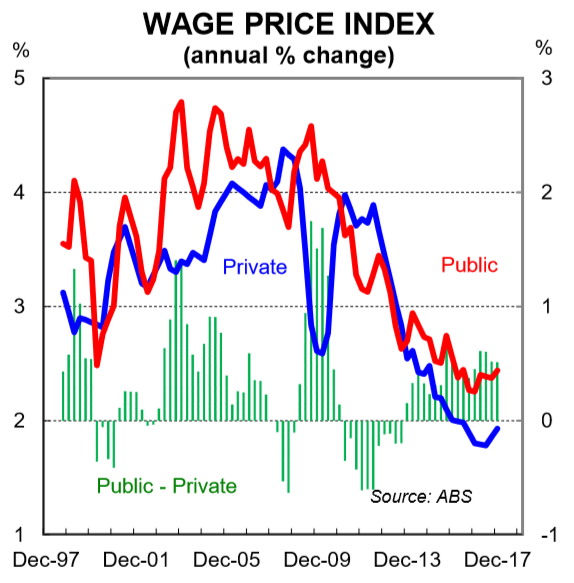
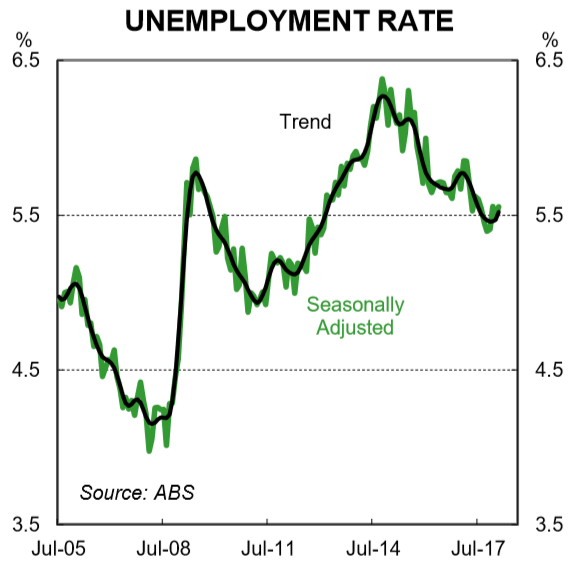
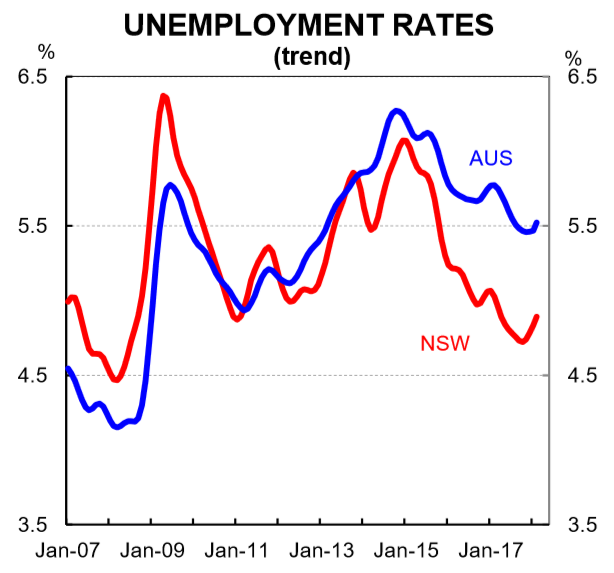
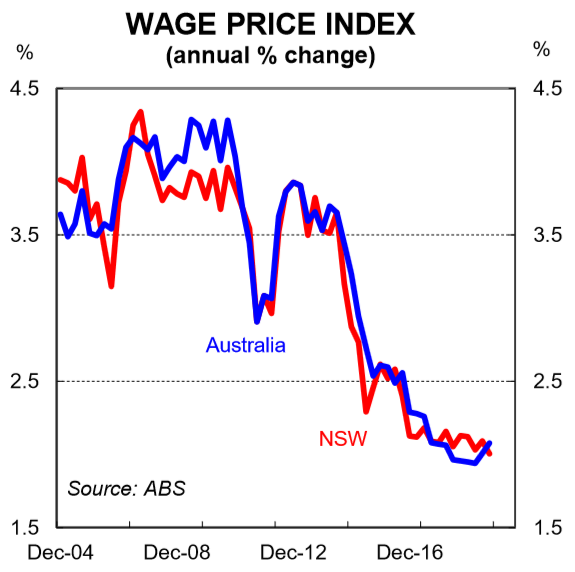
Australia’s unemployment rate has been moving lower since Q4 2014 when it was 6.3% (chart 1). The seasonally adjusted rate printed at 5.6% in February 2018 while the trend rate held firm at 5.5%. The downward trend in the unemployment rate is desirable. But it’s been a slow grind and a faster decline would be preferable. Over the past few years wages growth has softened. The Wage Price Index (WPI) was running at 2.1%pa at Q4 2017. The composition showed that wages growth was 1.9%pa in the private sector and 2.4%pa in the public sector (chart 2). This means that the pulse of underlying wages growth is weak.
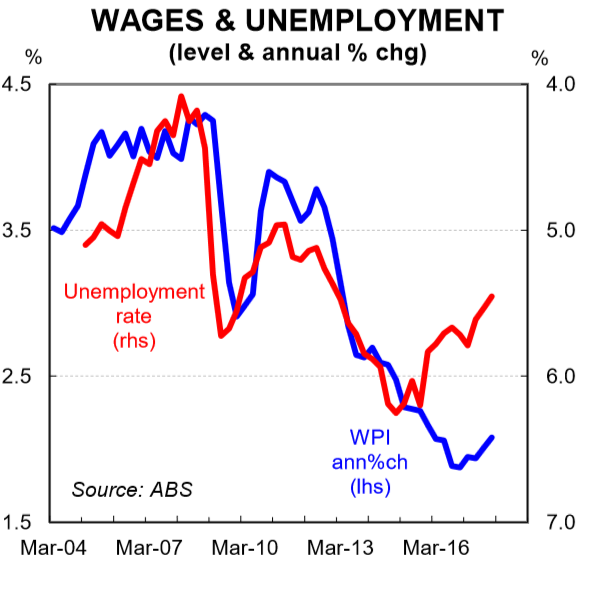
In summary, wages growth has not lifted despite the unemployment rate falling (in fact wages growth was slowing until recently). This is an unusual occurrence (chart 3). Normally we would expect to see wages growth rise as unemployment declines and vice versa. We have covered the reasons for the weakness in wages growth previously.
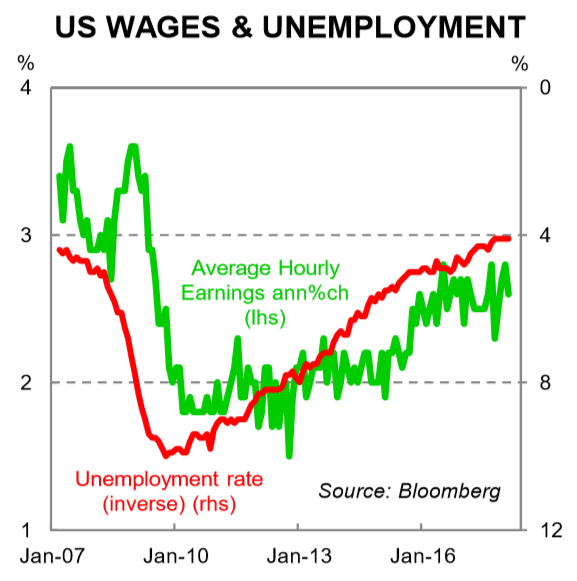
We still believe that there is an inverse relationship between the level of unemployment in the economy and wages growth (i.e. the Philips Curve). The US provides us with the recent evidence that the relationship still holds (albeit that wages growth is only 2¾%y/y despite the unemployment rate sitting near 4% (chart 4). But the relationship is still there even if it is not as strong as previously (i.e. the Philips Curve has flattened).
From the perspective of the outlook for wages growth in Australia, the concept of the NAIRU is important. That is, if we can estimate the level of unemployment below which wages inflation rises then we have a better idea of estimating when wages growth is likely to materially lift. The RBA’s work puts the NAIRU currently at 5%, but it may be lower.
Why the NAIRU might be lower than the RBA’s estimate
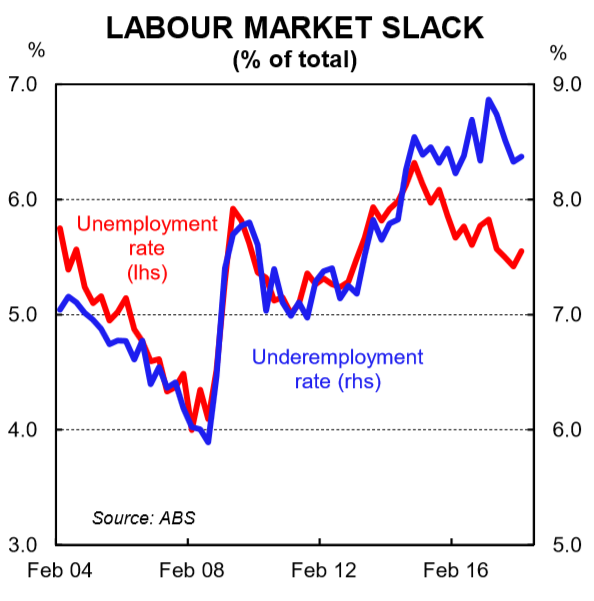
Underemployment not captured: The RBA’s model that is used to estimate the NAIRU is based solely on the unemployment rate as the measure of labour market slack. It does not include the underemployment rate (i.e. the proportion of people who have a job but are seeking to work more hours). Historically that would be fine because the unemployment and underemployment rates tended to move in unison (both in direction and in magnitude). But in recent years, the spread between the unemployment and underemployment rates has increased (chart 5). This means that changes in the unemployment rate alone are no longer a sufficient proxy for changes in labour market slack.
If the spread between the unemployment and underemployment rates stays elevated, and we take the RBA’s 5% NAIRU estimate at face value, then it means the NAIRU is likely to be below their estimate, all else equal.
Employee bargaining power is lower: Here we enter the subjective domain of employee bargaining power. Clearly, the capacity of employees to negotiate pay rises is impacted by the level of slack in the economy. So there is circularity in looking at employee bargaining power. But what if there has been a decline in the capacity of workers to negotiate pay rises that is independent of the level of unemployment in the economy? This is not exactly observable, although it may be that strong growth in labour market supply has reduced the capacity of workers to negotiate pay rises.
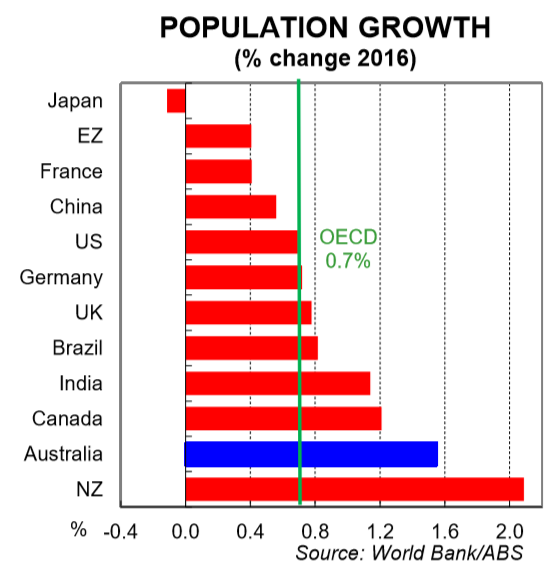
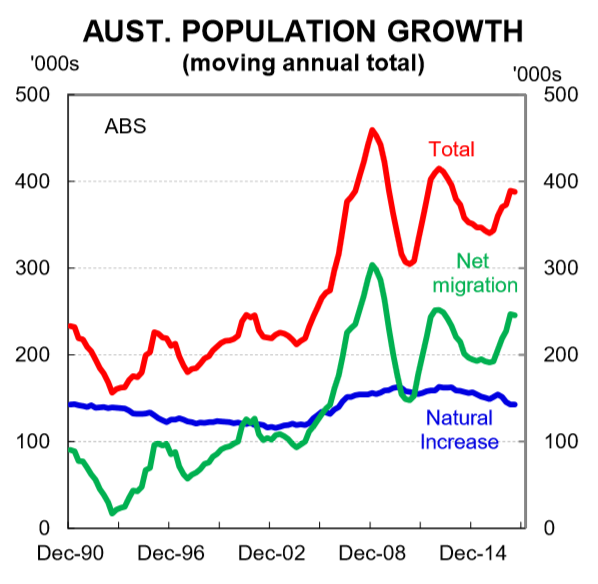
How? As we have discussed before, Australia has adopted a policy decision to run a very high immigration program by OECD standards (charts 6 and 7). It has continued down this policy path despite several years where labour market slack has been elevated (that is, there has been plenty of Australian’s looking for work in some capacity). From a wages perspective, immigration augments the supply of labour beyond what would have naturally occurred. That intensifies the competition for existing jobs while of course also adding to the demand for labour. The bigger the supply side shock, the more that the competition for existing jobs intensifies. This puts downward pressure on wages initially, but its effect should only be temporary. However, if the supply side shock continues when slack is elevated the temporary impact may not prove to be so short lived.
In many ways, this is the result of running a high immigration program when there is plenty of slack in the labour market based on the notion of skills shortages. In 2016/17, the “Skill Stream” accounted for 67% of the total migration programme outcome. From the perspective of an employee, working in an industry that has a skills shortage means that the labour market in that profession should be tight. In industries with skills shortages, bargaining power between the employee and employer should move more favourably in the direction of the employee and higher wages should be forthcoming. But in Australia’s case at the moment there is no evidence of widespread skills shortages based on the broad-based weakness in wages growth. The relatively high intake of skilled workers looks to be a pre-emptive strike on the expectation that there will be skills shortages in the future. It does not appear to be a policy response to the evidence of skills shortages. This has implications for wages and the NAIRU.
If “skills shortages” are not able to manifest themselves because employees are consistently able to hire from abroad, then employees have had a reduction in their bargaining power that is independent of the level of slack in the local labour market. Essentially talent is not scarce because firms can hire from a global pool of labour. The downward pressure that this applies on wages growth is amplified if a worker from abroad is able and willing to work at a lower rate of pay than local residents. Given the attractiveness of Australia as a destination to live and work relative to so many other places it is reasonable to assume that this occurs to some extent. The upshot means that employee bargaining power is lowered at the margin which therefore puts downward pressure on the NAIRU, all else equal.
NSW – the example
The national unemployment rate is 5.6%. But in NSW it is 4¾% where it has been for the past year (chart 8). This is obviously below the RBA’s estimate of NAIRU. And yet there is no signs yet of a lift in wages inflation in Australia’s largest state (chart 9). In fact, the NSW WPI was 2.0%y/y at Q4 2017, slightly below the national rate. While we would generally caution into reading too much into state data to ascertain relationships between economic variables relative to data at the national level, what’s occurred does support the notion that the NAIRU may be lower than the RBA’s estimate. It certainly indicates that wages inflation has not lifted in NSW despite the unemployment rate dropping below 5%.
Implications
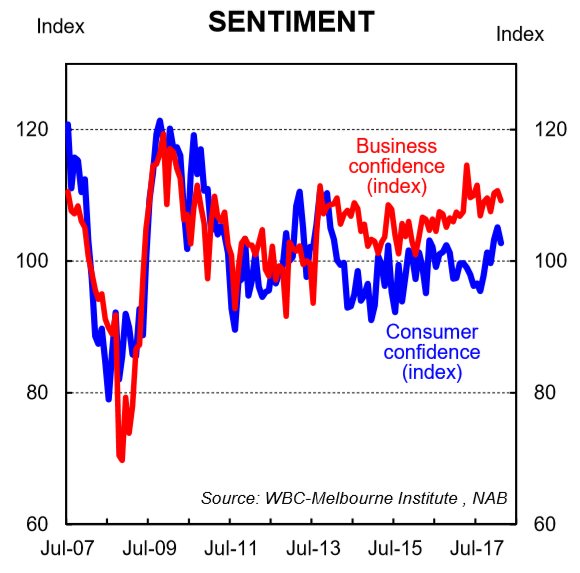
If the NAIRU is indeed lower than 5% in Australia then there are basically three key implications: (i) a meaningful lift in wages growth will be further away than what is implied in RBA and Treasury forecasts, all else equal (given these forecasts are built on a NAIRU of 5%); (ii) the disparity between strong business surveys against weaker consumer confidence surveys will persist (chart 10) – lower wages growth a positive for businesses and a negative for households; and (iii) it becomes less likely that the RBA lifts the cash rate over the next year given that is must become clear that wages growth is on a sustained upward trend before monetary policy is tightened.