
By Martin North, cross-posted from the Digital Finance Analytics Blog:
The RBA has quietly revised down the household debt to income ratio stats contained in E2 statistical releases and their chart pack. It has dropped by 6% from 199.7 down to 188.4. So far as I can see, there is no explanation for the change. Nothing in the E2 sheets.
This is on top of the reduction in the growth in investment mortgages we discussed before.
More rubbery numbers, we suspect trying to play down the size of the mortgage debt problem. RBA please explain!
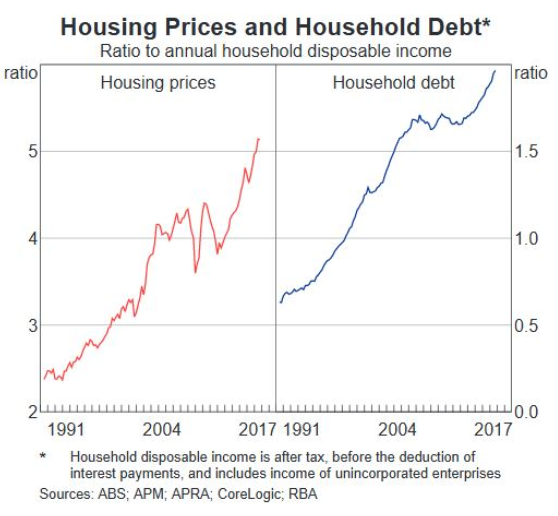
This is the original chart from February (199.7).
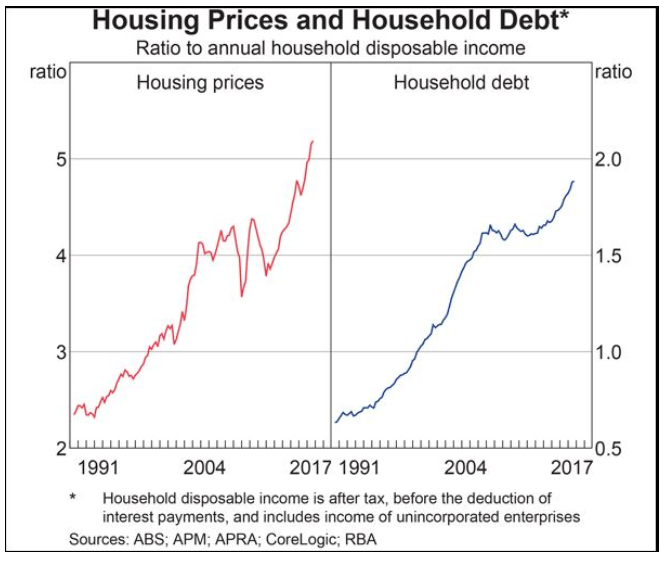
This is the revised version, now available from the RBA site. Also they changed the scale, so it looks better too!
Now, we happen to retain the previous versions of the underlying RBA E2 series which by the way is derived from the ABS data series, and massaged by the RBA. Household debt is sourced from ABS Cat No 5232.0. Debt includes debt owed by unincorporated enterprises, and does not appear to have changed.
We can track the changes the RBA made to the series. Last months figure dropped a magical 6%, to 188.4. It runs right across the series. The blue line is the original series, the orange one the revision.
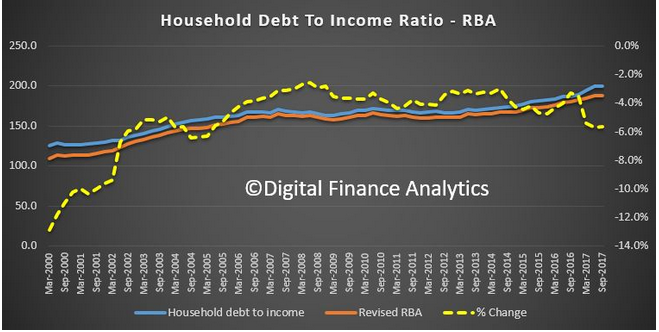
This may have something to do with superannuation accounts, but unless I missed it, there has been no explanation of the changes.
If you know why it changed, do let me know!