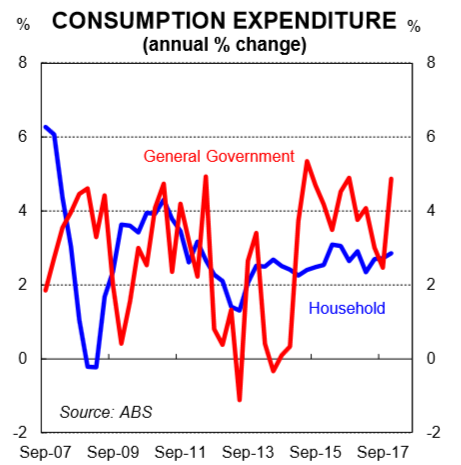
General government consumption growth has materially outpaced household consumption growth over the past three years.
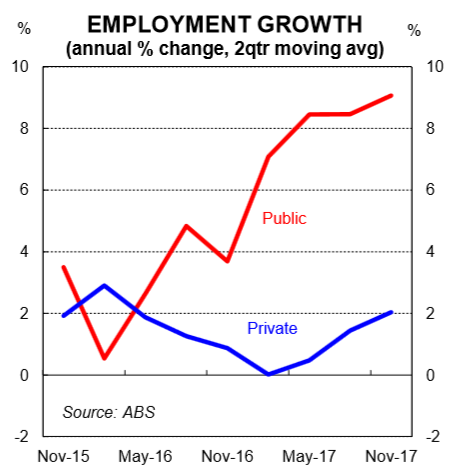
Public sector jobs growth has significantly outpaced private sector jobs growth over the past two years.
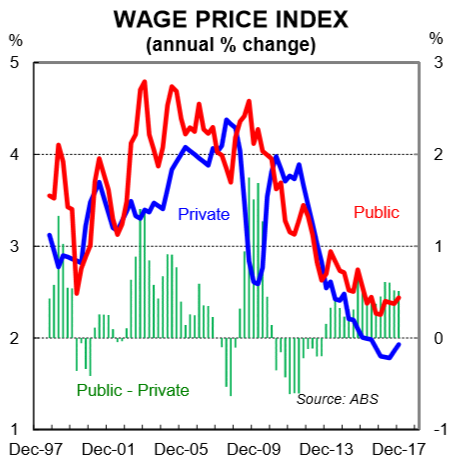
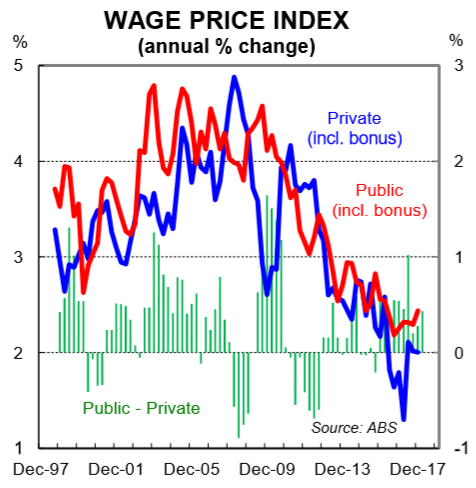
Public sector wages have been growing at a faster pace than private sector wages for most of the past twenty years.
The case to cut personal income tax rates is growing.
Overview:
In this note we take a look at the most recent trends in employment, wages and consumption from a public/private sector perspective. The results indicate that the public sector has been putting on headcount at a much faster rate than the private sector. And wages growth of those workers in the public sector has been stronger than that of workers in the private sector. Growth in public sector employment boosts demand in the economy in the short run, but there is a financial cost that is born by taxpayers. That cost is amplified when growth in public sector salaries outstrips that of workers in the private sector.
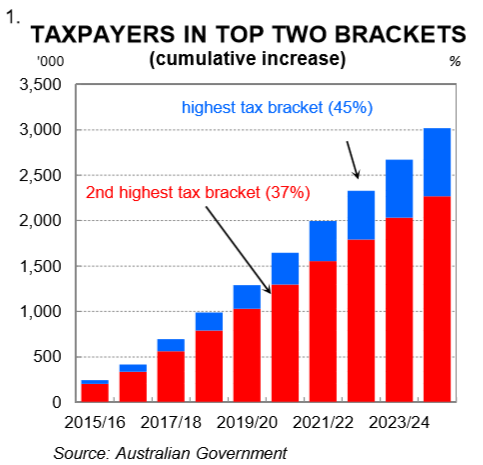
Bracket creep means that workers are handing over an increasing proportion of their salaries each year to the Government (chart 1). This weighs on household consumption. The Q4 2017 national accounts, published last week, showed that household consumption growth has been materially less than the growth rate in generation government consumption. These trends are unsustainable in the long run. We explore the issues below.
Employment
One of the defining features of the Australian economy over 2017 was incredibly strong growth in jobs. But the growth rate in public sector employment was significantly stronger than the private sector. The ABS publishes quarterly data that splits employment by the public and private sectors. The most recent data is to November 2017. It indicates that total employment rose by 387k over the year comprising a lift in public sector jobs of 118k (30% of total jobs) and private sector jobs of 269k (70% of total jobs). From a growth rate perspective, public sector employment rose by a whopping 7.6%pa while private sector employment was up by 2.6%pa. Clearly, the headline employment growth figures have been flattered by growth in public sector jobs. In fact, public sector jobs growth has been very strong over the past two years (see chart 2, note that we have smoothed the data out on a 2qtr moving average basis).
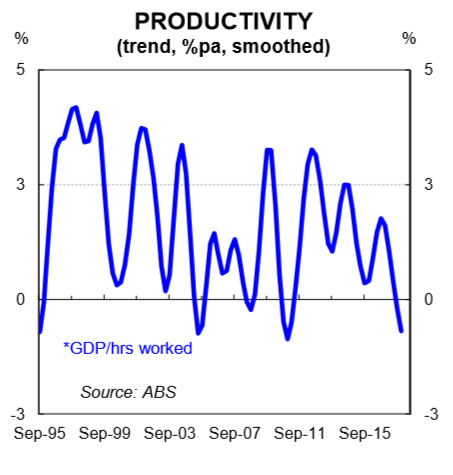
From an industry perspective, the big lift in public sector employment over the past two years has been in health (+63k) – driven in part by the NDIS, education (+59k) and admin, safety and IT (+24k). While clearly essential, a lift in some frontline health services, like health care, does not deliver much of a productivity dividend (as measured by output per hour worked). As a result, it’s probably not surprising to have seen productivity growth slow in Australia over the past year (chart 3) given public sector jobs, particularly in health, education and admin, accounted for almost a third of the lift in employment.
It’s worth noting that public sector jobs only comprise government units and units controlled by government. The big lift in public investment over the past two years, which will help boost productivity in the long run, has largely been delivered by the private sector. As such, the reported lift in headcount in the public sector is understating the direct impact that government policy has had on labour hiring over the recent past.
Wages
Weakness in nominal wages growth over the past few years has been well documented. There are a few reasons for it, but the primary one is that there is plenty of spare capacity in the labour market which reduces the ability of employees to negotiate pay rises. The decline in wages growth has been broadbased across the private and public sectors, although the magnitude of the slowdown has differed.
The Wage Price Index (WPI)* was running at 2.1%pa at Q4 2017. But the composition showed that wages growth was 1.9%pa in the private sector and 2.4%pa in the public sector – a spread of 51bps in favour of the public sector. On the surface this spread doesn’t look too big and doesn’t imply a big disparity in relative wages growth. But what is striking is that the spread between public and private sector wages growth has been positive for most of the past 20 years (see chart 4). To be precise, the annual rate of change in the public sector WPI has been above that of the private sector for 56 of the past 78 quarters. Annual growth in private sector wages has only been above the public sector for 21 of the past 78 quarters. This is quite astonishing. A reasonable assumption would be to expect the spread between public and private sector wages growth to average zero over a 20 year period. But instead it has averaged +34bps. In other words, the annual rate of growth in public sector wages has been on average 34ppts higher than the private sector for the past 20 years. The results are no different when using the WPI that includes bonuses (chart 4). They suggest that the more unionised public sector workforce has more collective bargaining power than the much less unionised private sector. But it is very hard to make a justification for this disparity over such a long period of time. And the compounding impact is large.
* We use the WPI because it’s a pure measure of wages inflation. That is, it measures changes in wages across a range of industries (just like the CPI picks up price changes for a basket of goods), and does not include compositional changes in the labour market.
Consumption Growth
Household consumption growth has been modest and broadly stable over the past few years despite wages growth slowing. That is because the savings rate has come down. Real household consumption growth was running at 2.9%pa in Q4 2017 and has averaged close to that rate over the past three years. But general government consumption growth has been significantly higher than that over the same period. Over the past three years, real general government consumption growth has averaged a touch above 4%pa (chart 6). It was running at 4.9%pa at Q4 2017. In other words, recurrent spending by government has significantly outpaced that of households over the past three years. It has been driven by all three tiers of government, although spending growth at the national level has outpaced that of state and local government.
The data is essentially telling us that the household saving rate has been falling so that households can maintain a modest level of consumption in the face of declining income growth. But growth in general government consumption, which is taxpayer funded, has been strong. Total aggregate demand has therefore been propped up by the government sector, but it must be paid for.
Bracket creep, where nominal wage inflation pushes people into higher tax brackets, has helped to fund a strong rate of growth in general government consumption. But it means that workers are handing over an increasing share of their income at a time when the savings rate is low, real wages growth is flat and household consumption growth is modest. It is no wonder that households are feeling the pinch.
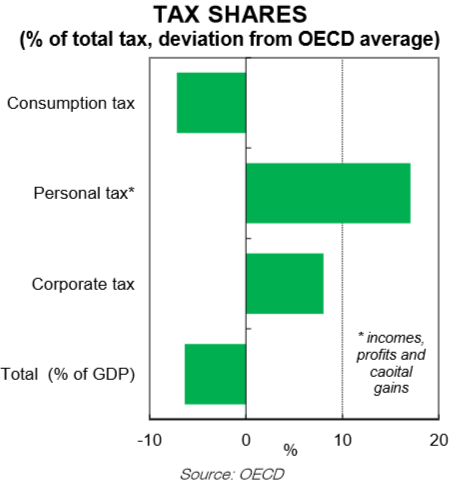
We are not in the business of pushing a policy agenda. But the trends in employment, wages and consumption from a public/private sector perspective point to the need for some of the disparity to be narrowed. Slowing the rate of growth in general government expenditure while providing income tax relief for households would seem a logical and equitable step in the right direction. In addition, tax reform to shift the tax mix more broadly should be considered. Relative to the OECD average, Australian tax collections are significantly “overweight” personal income tax and “underweight” consumption taxes (chart 7). This means that workers in Australia are shouldering a disproportionate tax burden relative to most other comparable nations. And that burden is being magnified each year through bracket creep.