
By Chris Becker
It’s effectively the last week of the trading year, so that means the last Trading Week wrap up for the calendar year. Its been a big year of risk taking – otherwise know as central bank supported buying of risk assets for almost no risk to capital – with the major catalyst at the tail end being a more aggressive interest rate agenda from the Federal Reserve.
What does this mean for 2018? The biggest risk to err, risk, is Trump – either his tax bill doesn’t pass and/or the backlash from it ends in legislative defeat in the upcoming mid terms, plus the huge chance of impeachment following the Mueller investigation. I’ll have more thoughts on this when I return to blogging in the new year while David and Leith have their well deserved holidays.
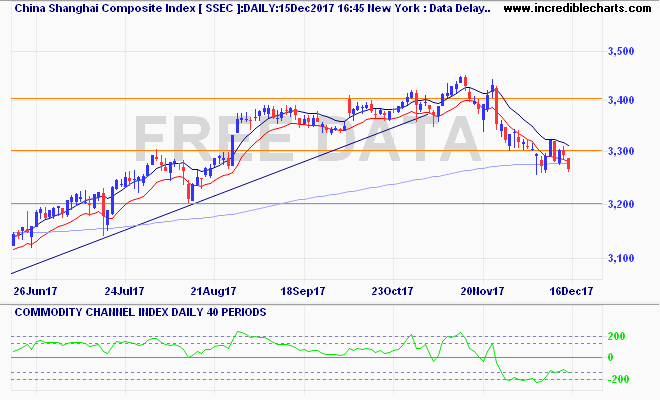
Looking at the longer term view on stock markets first, the Shanghai Composite has again been pushed below the key support level at 3300 points, hovering around the sticky 200 day moving average on the daily chart below. Note that while this correction has been orderly so far, the high moving average has not been touched, so I’m watching the daily lows here for signs of a follow through:
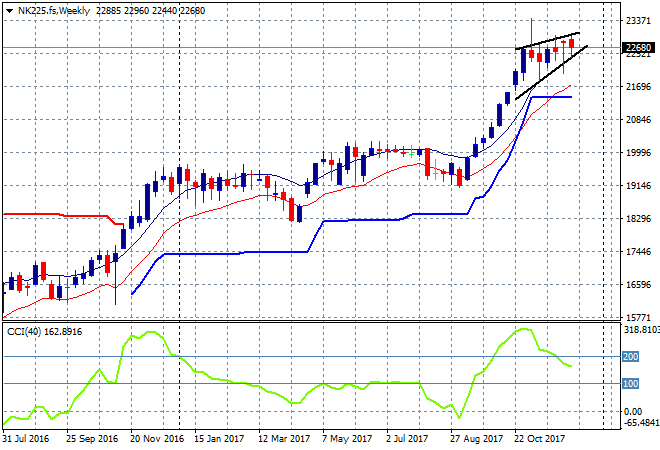
Japanese stocks still want to push higher but have been unable to turn this into substantive moves higher due to a much stronger Yen. Last week saw a new low and a firming bearish rising wedge pattern on the weekly chart as momentum reverses and crosses into potential swing short category. I’m watching the lower bound of this wedge pattern for a possible breakdown:
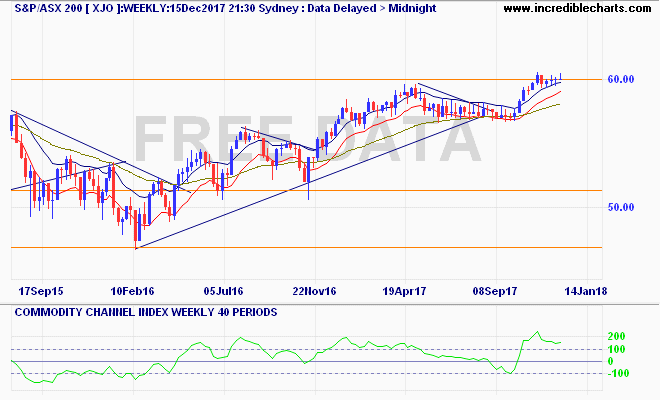
In local shares, the ASX200 wants to get back above 6000 points but can’t make it stick. Although the weekly chart shows a nice clean moving average band with all price above the higher level, there is no suggestion here yet of wanting to breach higher as price tightens:
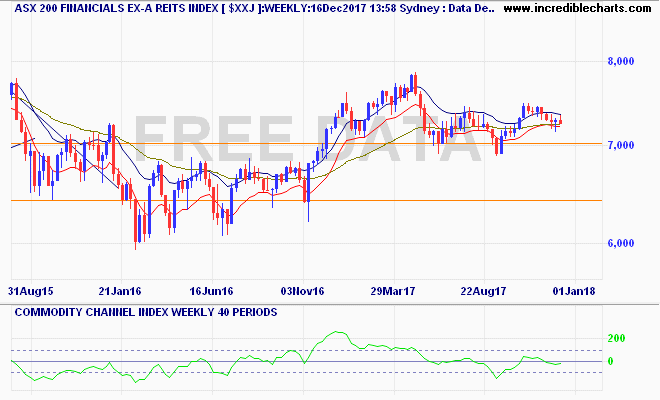
And the reason is the banking sector, which makes up half the index. The XXJ index is in a bearish sideways phase here due to concerns surrounding the commission into Megabank itself. The 7000 support level is proving to be an anchor instead of a launch pad into new highs for the ASX200:
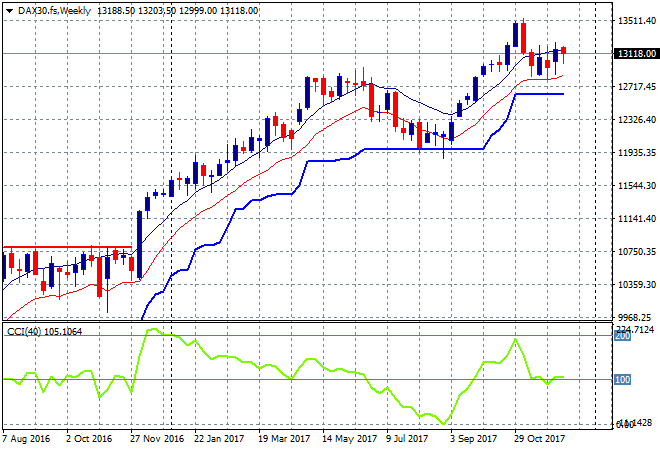
The German DAX remains in a consolidation phase and although if finished the week a bit lower it remains above the 13000 point level. So far, very orderly as you can see on the weekly chart after the too far/too fast breakout previously above 13500 points. I’m watching the low moving average and ATR support here for signs of a sudden reversal on sentiment however:
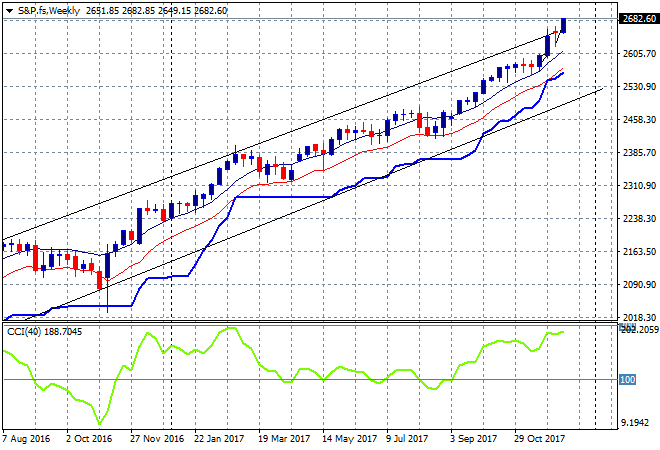
The S&P500 made another new record high, absorbing the Fed meeting and interest rate rise with aplomb, and indeed the squabbling over the tax bill in Congress. It always pays to be optimistic about US stocks regardless of the risk surrounding them, but a small retracement over Christmas is likely here:
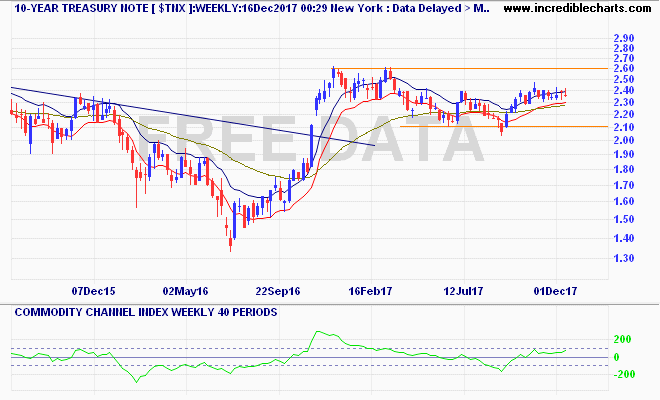
US 10 year Treasury yields remain solidly attracted to the 2.4% level as they continue to be under pressure as the yield curve flattens. Support is firm at 2.3% at the low moving average level with no real upside potential here:
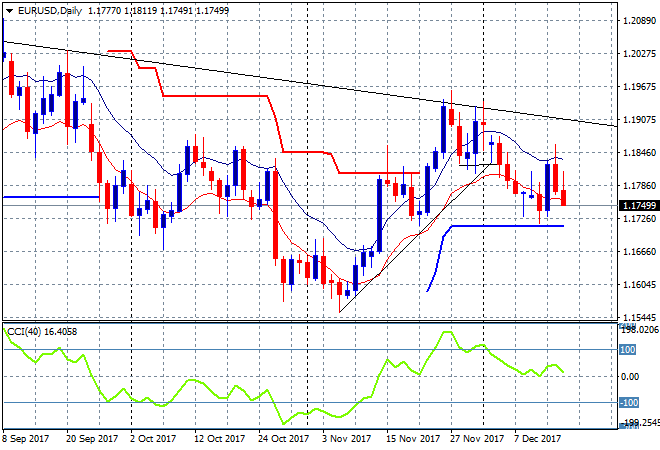
On to currencies, where the daily chart of Euro continues to show a breakdown after rejecting the 1.19 high and the weekly downtrend line overhead in the previous week, falling to but not below trailing ATR support at the 1.17 handle. The ECB meeting handed traders a swift reversal intrasession, but this week might show some more selling if ATR is threatened:
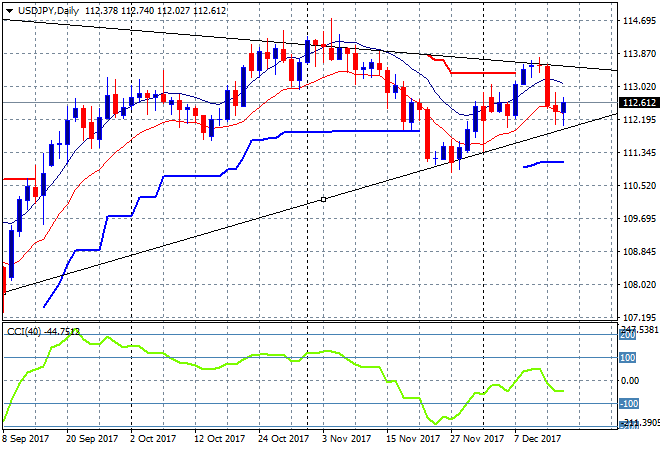
The daily chart of the USDJPY shows a tightening pattern of higher support and lower resistance which is part of a new pattern on the weekly charts. While still respecting the uptrend from the 107 low, Yen buyers continue to push the USDJPY pair to lower highs. The Uncle points here are obvious for any breaks this week:
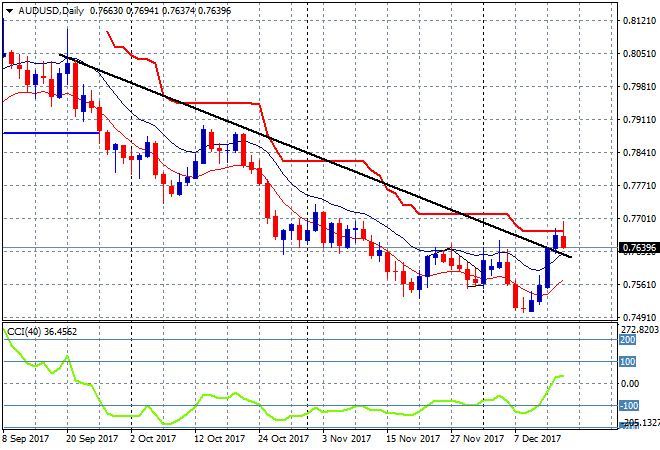
The Aussie dollar had a good comeback last week as the unemployment print provided some short covering opportunities, stalling the descent down to the previous weekly low at the 73.60 level. Indeed, the daily downtrend line has been broken, but not daily ATR resistance at the 77 handle against USD, so its too early to call a new trend here:
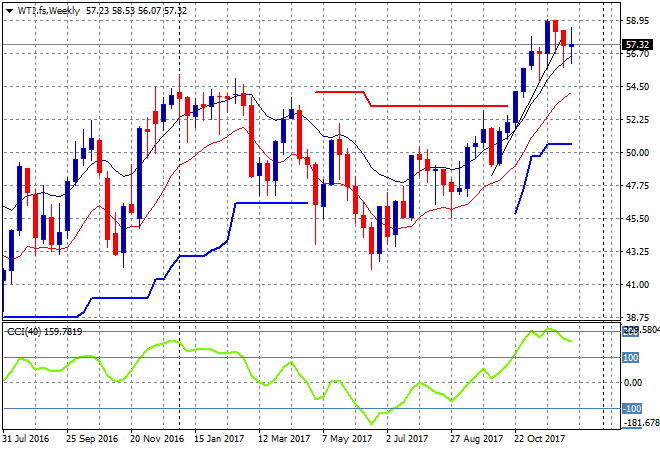
The weekly chart for WTI oil shows a pause here before the Northern Hemisphere winter really kicks in, normalising the too fast uptrend into a better tracjectory. The target here remains the start of year high at $60:
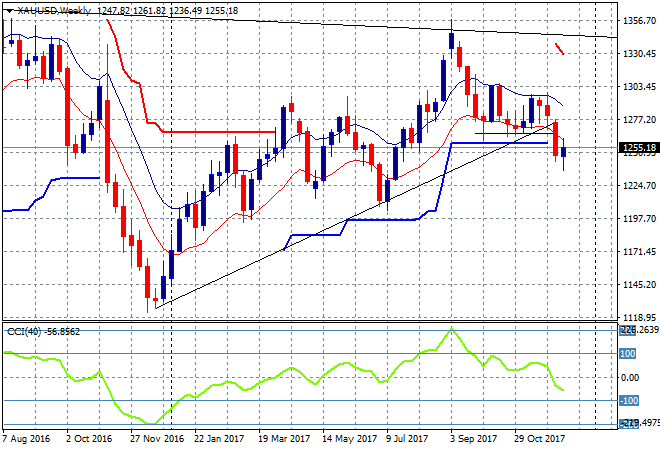
Gold’s trajectory however is pretty clear: down! Although there was a small bounce last week, price remains below ATR weekly support at $1265 and more importantly, the weekly uptrend line from the start of the calendar year. Not a good sign for the bulls, with $1200 my downside target still on the go:
Glossary of Acronyms and Technical Analysis Terms:
ATR: Average True Range – measures the degree of price volatility averaged over a time period
ATR Support/Resistance: a ratcheting mechanism that follows price below/above a trend, that if breached shows above average volatility
CCI: Commodity Channel Index: a momentum reading that calculates current price away from the statistical mean or “typical” price to indicate overbought (far above the mean) or oversold (far below the mean)
Low/High Moving Average: rolling mean of prices in this case, the low and high for the day/hour which creates a band around the actual price movement
FOMC: Federal Open Market Committee, monthly meeting of Federal Reserve regarding monetary policy (setting interest rates)
BOJ/Abenomics: Bank of Japan, economic policy/direction enacted by PM Shinzo Abe
DOE: US Department of Energy
Uncle Point: or stop loss point, a level at which you’ve clearly been wrong on your position, so cry uncle and get out!