
By Chris Becker
The Christmas stock market rally continued overnight with US and European bourses both putting on meaningful gains following a successful start to the week here in Asia yesterday. This is all in anticipation of the upcoming vote on the Republican tax plan and an environment where no-one is bearish anymore. That always ends well right?
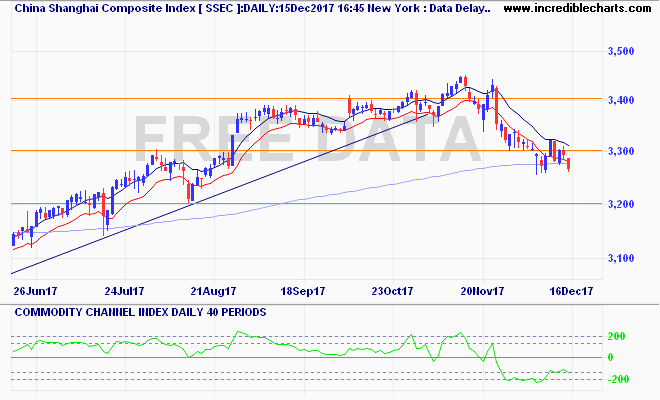
Recapping action in Asia yesterday where in mainland China the Shanghai Composite remained under pressure, falling after the lunch break before a quick recovery to be square at 3267 points at the end of the session. The 3300 point level is anchoring price action as resistance now but the bears are not yet in charge. I’m watching the daily lows for signs of a breakdown here:
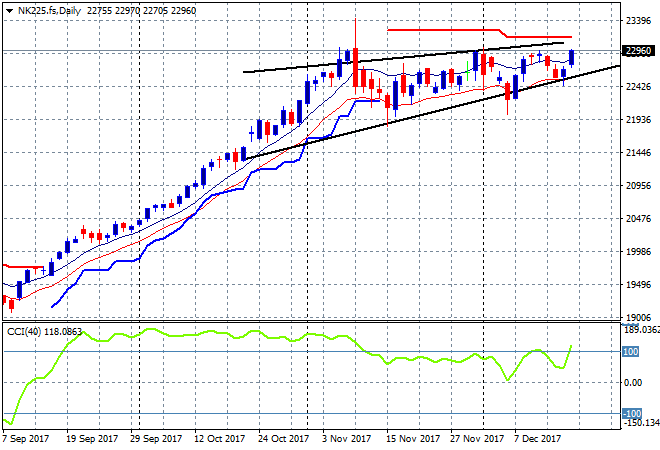
Japanese stocks came back strongly with the Nikkei 225 surging 1.5% following the Friday night move higher in the positively correlated USDJPY pair, but failed to close above overhead resistance at 23000 points. Support remains firm here above the previous daily low at the 22200 mark, but resistance at 23000 proper is the key level to beat this somewhat bearish rising wedge pattern:
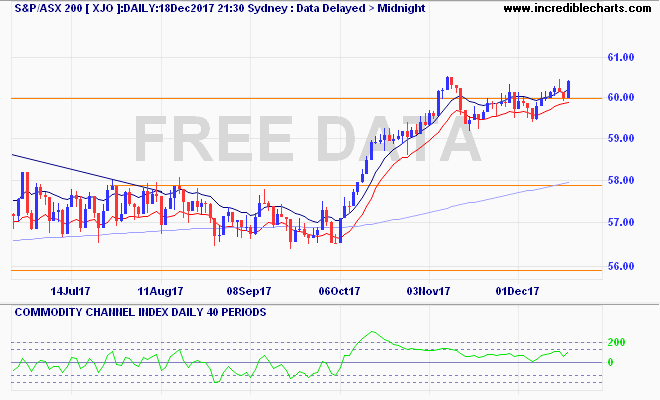
Santa loves Aussie stocks with the ASX200 pushing above 6000 points closing up 0.7% to 6038 points. This was all led by the banks, as the XXJ financial sector lept the same amount, as the Bennelong by-election result takes some heat off the political quango surrounding the most protected business in the Australian economy. SPI futures have surged again on the back of the US rally so we might see the early November high threatened here:
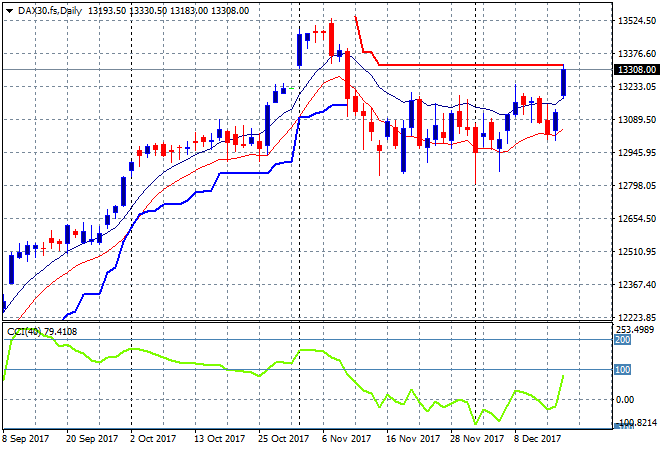
On to Europe, where caution is being thrown to the wind with almost all markets up 1% or more as the Euro continues to weaken against USD. The German DAX gained over 1.5%, launching above the high moving average on the daily chart and making a run at nominal overhead resistance at the 13300 point level. I’m watching for a follow through here tonight:
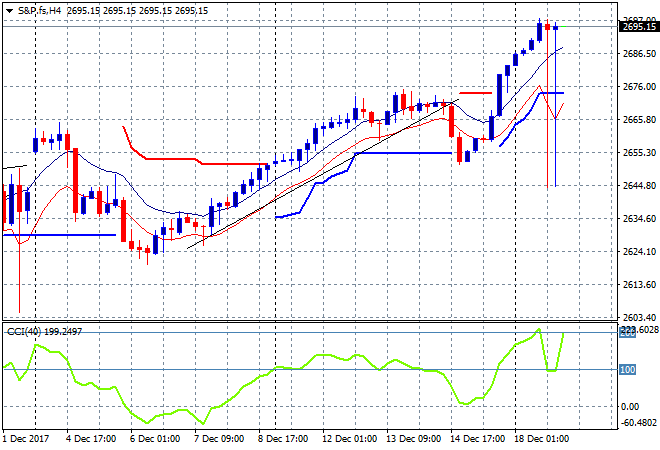
US stocks made new highs again – yawn – with the S&P500 up 0.5% in a solid session (ignore the weird candles on the four hourly chart below!) Note how overreached momentum is to the upside, a usual sign of an upcoming retracement to the mean trend, but this is no longer a “mean” trend – its just BTFD and keep going:
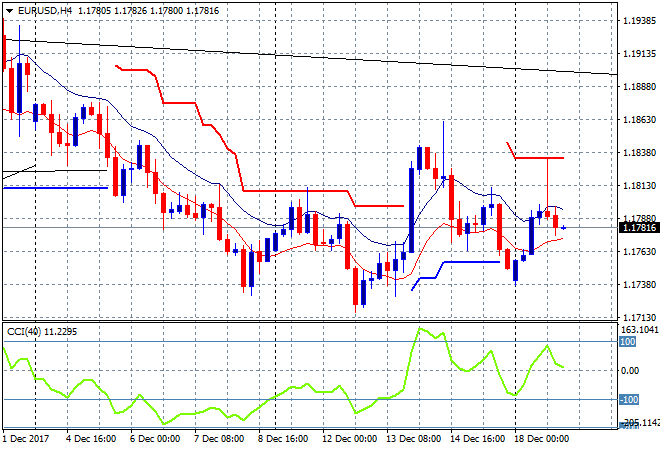
On to currencies where the Euro again tried to sniff above the 1.18 handle before returning back to its slow meltdown against USD. The four hourly chart is fairly directionless here with the moving average band twisting around the high 1.17’s with only the spectre of the longer term daily/weekly downtrend above pushing it down:
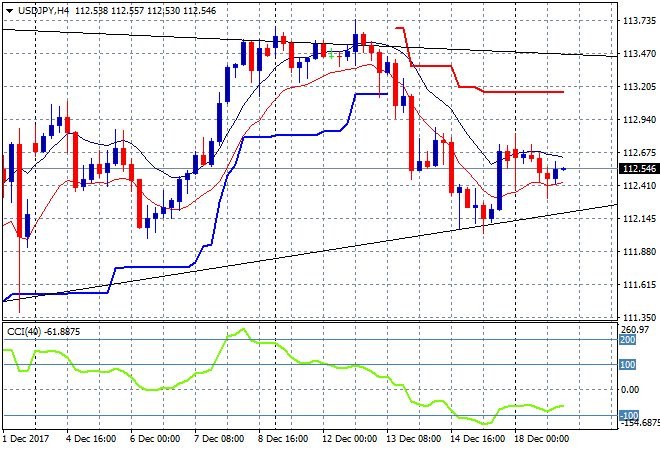
Yen remains strong against USD with the USDJPY pair falling slightly overnight after its mild gap open yesterday. Price remains stuck between the pincers of the weekly uptrend and downtrend lines, with the moving average band sideways with a slight bearish bias:
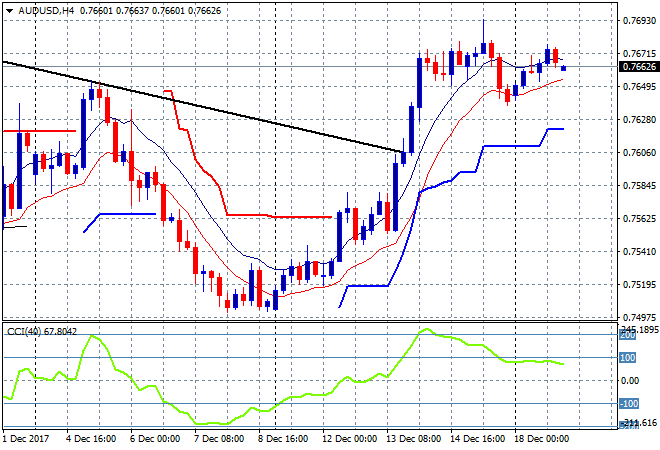
The Aussie dollar is still quite elevated against USD but this consolidation phase has not turned into a corrective one, with firm support at the mid 76s with a series of higher lows as price tries again to get back above the 76.70 level. That’s the area to watch going forward for an upside breakout:
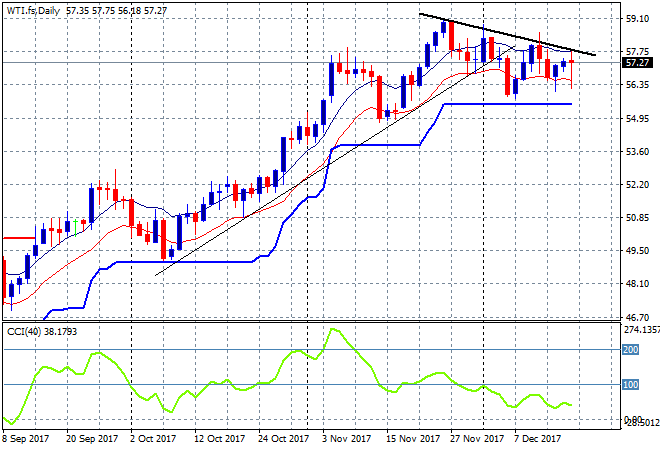
Oil prices came back slightly overnight but still nothing to get excited about with the WTI contract still remaining above daily ATR support and just above the $57USD per barrel level. ATR support at $55.50 is starting to get a bit closer here but no concern yet:
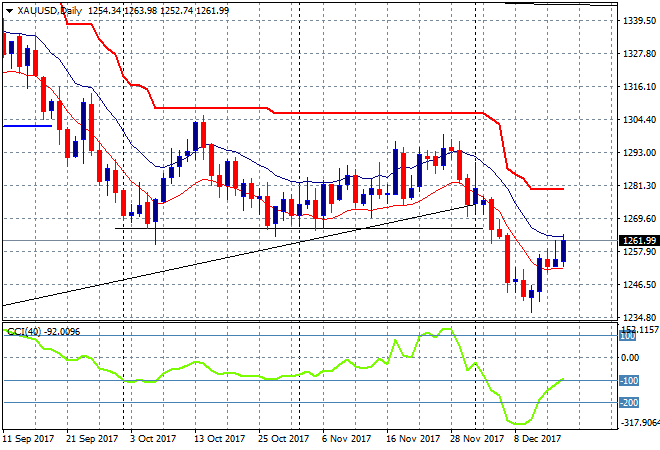
And to gold which is undergoing a slight swing long here from its oversold breakdown, up a few more dollars to $1262USD per ounce. This is close to former support, now firm resistance at the $1265 level which if it can’t get back above soon, the next weekly support level is at $1200-1215, so watch out below:
Glossary of Acronyms and Technical Analysis Terms:
ATR: Average True Range – measures the degree of price volatility averaged over a time period
ATR Support/Resistance: a ratcheting mechanism that follows price below/above a trend, that if breached shows above average volatility
CCI: Commodity Channel Index: a momentum reading that calculates current price away from the statistical mean or “typical” price to indicate overbought (far above the mean) or oversold (far below the mean)
Low/High Moving Average: rolling mean of prices in this case, the low and high for the day/hour which creates a band around the actual price movement
FOMC: Federal Open Market Committee, monthly meeting of Federal Reserve regarding monetary policy (setting interest rates)
BOJ/Abenomics: Bank of Japan, economic policy/direction enacted by PM Shinzo Abe
DOE: US Department of Energy
Uncle Point: or stop loss point, a level at which you’ve clearly been wrong on your position, so cry uncle and get out!