
By Gareth Aird, senior economist at CBA:
Key Points:
- GDP growth has lifted in 2017 and the labour market has tightened.
- Our base case has these trends continuing over the next two years, but there are a number of downside risks.
- The ability of monetary policy to support the economy in the event of a negative shock is more limited than in the past thereby exacerbating the potential impact that any negative shock may bring.
On some important metrics it’s been a reasonably good for year the Australian economy. The labour market has tightened courtesy of very strong employment growth and real GDP growth has lifted. At the same time, nominal GDP growth has been buoyant due to firmer commodity prices when compared to a year earlier. Wages growth, however, remains soft and real wages are barely in positive territory.
The house view is that the improvement in the labour market continues over the next two years and the unemployment rate should continue to grind lower. But there are plenty of risks that would change the outlook if they were to materialise.
This note discusses some of the key global and domestic risks to the Australian economy. It begins with an outline of CBA’s base case for the economy over the next two years before delving into some of the potential risks. This is not an exhaustive list, but rather it covers a few areas that the author considers to be the most acute risks to our central scenario. They are: (i) the capacity to respond to a negative shock with monetary policy (and to a lessor extent fiscal policy), (ii) a solid fall in commodity prices; (iii) a sharp correction in dwelling prices; (iv) a policy “mistake”; and (v) a fall in net migration via a policy change.
CBA’s central scenario
CBA’s base case for the economy over the next two years is a benign one. It is broadly similar to the RBA’s forecast profile for the economy which is also not dissimilar to the consensus view.
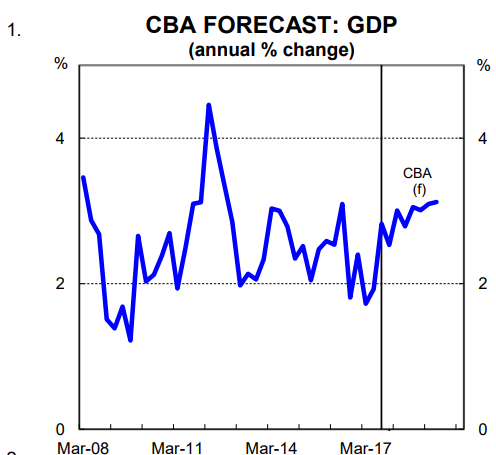
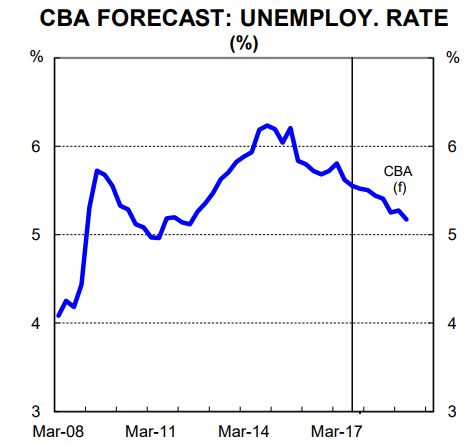
On the key components, we see output growth continuing to lift to a pace of around 3%pa in 2018 (chart 1). We put potential growth at 2¾% (population plus productivity growth) which means our forecast profile has a gradual decline in the unemployment rate as spare capacity recedes (chart 2). In 2018, most of the key components of the economy are expected to contribute to growth, with dwelling investment the exception.
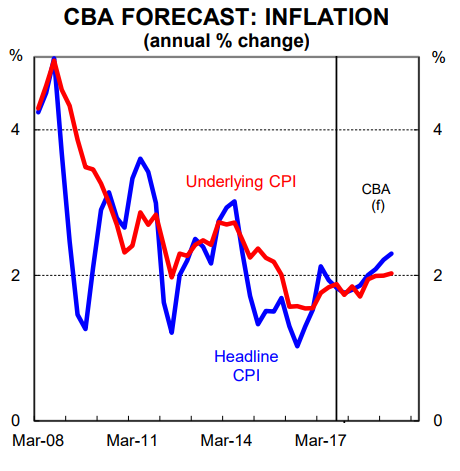
Our base case has inflation remaining soft due to elevated slack in the labour market which is suppressing wages growth. We have core inflation tracking at the bottom of the RBA’s target band (chart 3). This means that a rate rise still looks a long way off. We have commodity prices drifting a little lower which means that we expect the terms-of-trade to ease over the next few years, but to remain above its trough in early 2016. As a result, nominal GDP growth should step down.
We don’t explicitly forecast dwelling price growth. But the most likely outcome, in our view, is for dwelling price growth to slow and converge with household income growth (i.e. a low single digit annual growth rate). Such an outcome would also represent a best case outcome from a financial stability perspective.
We expect housing credit growth to continue to slow driven by a further easing in lending growth to investors.
The capacity to respond to a negative shock with monetary and fiscal policy
Monetary policy: While strictly speaking not a risk to the economic outlook per se, in many ways the reduced capacity to respond to a negative shock, particularly via monetary policy, is the biggest risk to the economy outlook.
Over the past 30 year the interest rate lever has been used to smooth out business cycles. When output and employment growth have fallen and/or the outlook for inflation has been lowered, interest rates have come down.
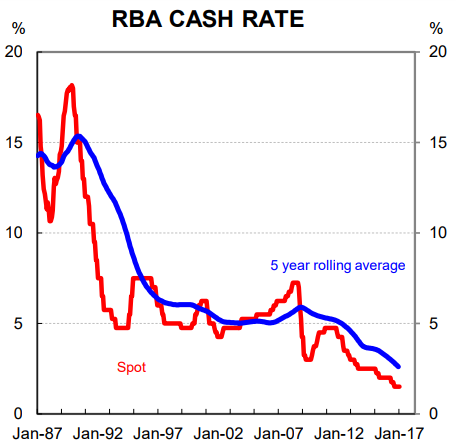
Conversely, the policy rate has been raised when it’s been necessary to slow the pace of growth and inflation in the economy. That process has worked relatively well. But it may have a limited shelf life because it’s required a structural decline in interest rates to support the economy over the past 30 years (chart 4).
The amount of fire power the central bank has on the cash rate front is effectively the difference between the current policy rate and the lower bound. We aren’t at the lower bound yet. But with a current cash rate of 1.5% we are close. In our view, a policy rate of around 0.75% would probably be the lower bound in Australia, which is higher than the lower bound of many other advanced and bigger economies. In the Eurozone and Japan, for example, policy rates have gone negative. But these regions run current account surpluses which probably gives them greater scope to take rates down without causing a massive fall in their currencies (chart 5). In Australia, it may not be possible to cut the cash rate below 0.75% because the current account deficit has been sizeable in the past as a share of GDP and must be funded (note that the current account deficit would blow out if there was a negative commodity price shock). As a result, there may only be a few rate cut ‘bullets’ left if we are right. The RBA will hope that if/when the next shock arrives the cash rate is a fair bit higher than it is today to allow them scope to cut and provide stimulus to the economy. But while the cash rate sits at 1.5% the economy is more vulnerable than usual to a shock.
The limited capacity to stimulate the economy further via rate cuts means that the ability of household leverage to increase further is also hamstrung. As interest rates have come down over the past 30 years the stock of household debt relative to income has risen (chart 6). That is because households have been able to borrow more for a given level of income. As a result, Australia has
the second most indebted household sector in the world.
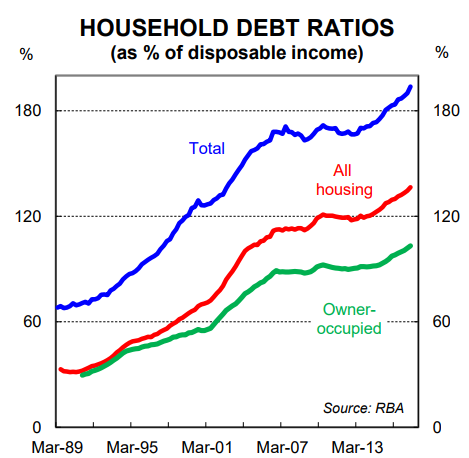
In previous downturns rate cuts both encouraged and made it possible for households to increase debt relative to income. That debt initially went into higher dwelling prices, but ultimately the new credit created found its way into consumption. But with very little capacity to take interest rates lower and with the household sector already very stretched, the consumer is not going to
absorb the next economic shock by borrowing through it.
Fiscal policy: There is some scope to stimulate the economy via fiscal policy if/when a negative shock arrives. In fact, the Government’s balance sheet looks in a much better condition than most other advanced countries when assessed on a debt to GDP basis. But we should not get too carried away because Australia has a structural deficit which means debt to GDP will rise quite quickly
if/when the next negative shock arrives. From here, any downturn in the economy would almost certainly see the Government’s triple A credit rating stripped. While there is some conjecture over the precise implications of losing the triple A, its loss would certainly carry some weight from a symbolic perspective given it’s been the proud boast of successive Treasurers.
A commodity price shock
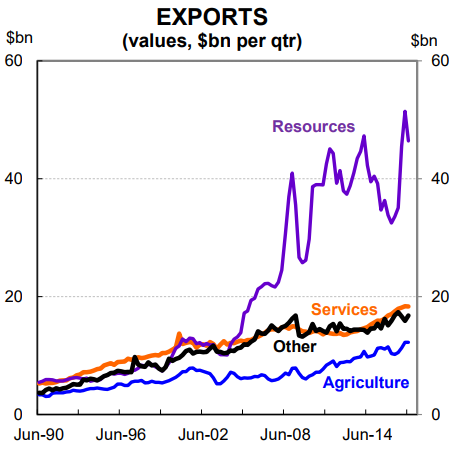
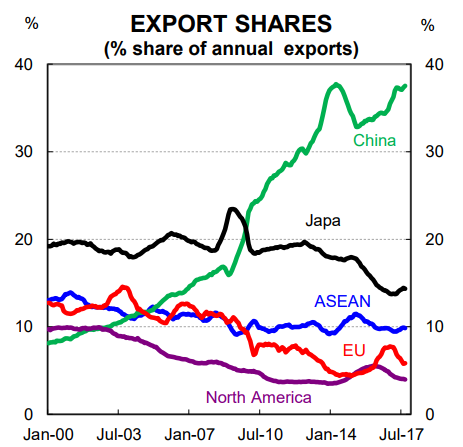
From an external perspective, a commodity price shock carries the greatest risk to the Australian economy. Australia continues to be heavily reliant on commodities for its resource revenue (chart 7). And a huge chunk of our exports go to China (chart 8). As such, the biggest threat to commodity prices is a slowdown in China that would lead to lower investment growth (or possibly
a fall in investment). Such a slowdown could occur it if the Chinese authorities accept a lower level of output growth for the sake of financial stability given the rapid build-up of corporate debt. It could also happen if a greater emphasis is placed on delivering growth through services rather than investment. And it could of course come via a China hard landing (a Trump-led lift in tariffs in the US, for example, could be the trigger). In any event, commodity prices get hit and that would have implications for the Australian economy.
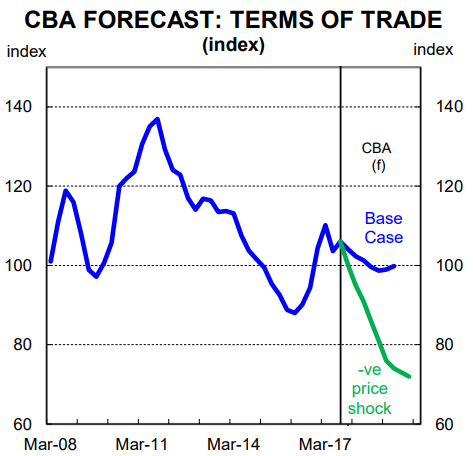
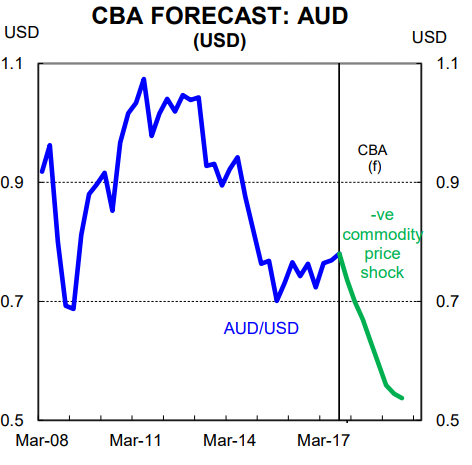
A sizeable fall in commodity prices would pull Australia’s terms-of-trade substantially lower. Roughly speaking, a 40% fall in commodity prices would see Australia’s terms-of-trade fall by 30% (chart 9). This is an illustrative example, but it is also represents a plausible outcome if there was a material slowdown in investment growth in China. In such a scenario the AUD could fall
to the low-mid US 50 cent mark (chart 10).
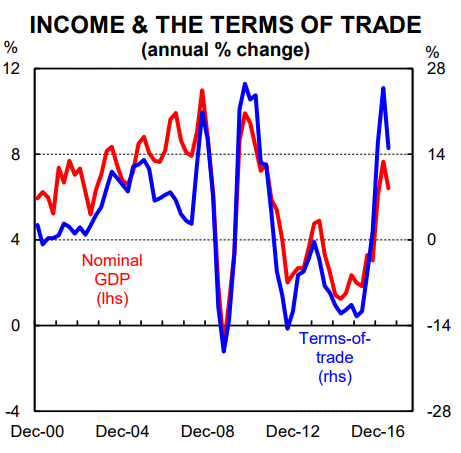
A terms-of-trade shock would weigh on income across the economy more broadly given the strong correlation between commodity prices and nominal GDP (chart 11). In addition, Government revenue would be hit because of the relationship between the terms-of-trade and the tax take. Finally, unemployment would rise. While a lower AUD would provide some support to the economy, the limited capacity of monetary policy to absorb a commodity price shock from here would see the unemployment rate rise faster than would otherwise have been the case.
The capacity of wages growth to slow further from here is also limited in the event of a commodity price shock. That is because wages growth is already at record lows and wages growth is sticky downwards. A fall in wages growth was able to cushion the most recent terms-of-trade shock (late-2011 to early 2016) because growth in wages slowed in line with the weakness in commodity
prices. This helped to support the labour market and keep the unemployment rate from rising as much as it otherwise might have. But this time, a fall in wages growth will not be able to absorb the shock to the same extent given wages growth is already so low.
A sharp correction in dwelling prices
The single biggest risk to the domestic outlook looks to be a sharp correction in dwelling prices. In our view, this carries a greater risk to the real economy than it does to financial stability given the banking system is well capitalised.
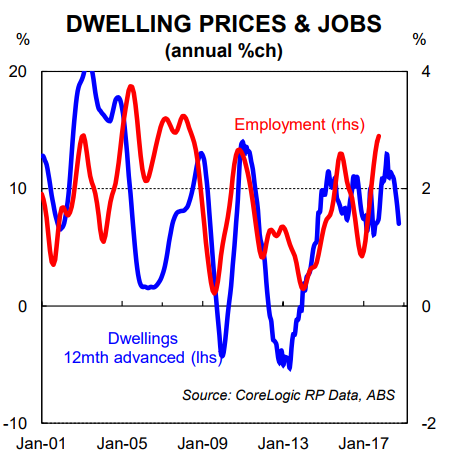
There is a commonly held belief in Australia that the main trigger for a fall in dwelling prices is a rise in unemployment. This seems logical because rising unemployment would generally be associated with a lift in mortgage delinquencies which would put downward pressure on prices. But the data suggests that employment is more likely to lag changes in dwelling prices rather than lead (chart 12). The obvious question to then ask is why? We attribute the answer, in part, to the wealth effect and the recent track record of monetary policy in smoothing out the business cycle.
In periods when employment growth is slowing, the RBA is generally easing policy. When this is occurring, as long as the RBA can fend off a recession, falling interest rates tend to push up dwelling prices via cheaper credit which in turn encourages spending and supports employment growth. Of course, it’s a different story if employment growth falls too fast and unemployment rises
sharply. But so far, at the national level, this hasn’t happened since the recession of the early 90s.
The risk of a material correction in dwelling prices looks higher now than it has been for a long time given: (i) the incredible lift in dwelling prices over the past five years; (ii) mortgage rates are probably unlikely to go lower and indeed can’t go much lower; (iii) household debt to income is at a record high; and (iv) dwelling supply is in the process of lifting quite significantly in some jurisdictions.
A soft correction in dwelling prices would probably have no material negative impact on the labour market. But there is a risk that a hard correction in prices (a fall of 20% or more) would lead the economy into a downturn via the wealth effect (i.e. the notion that changes in demand are influenced by changes in the value of assets). Since income to one person comes via the spending of
another, there is a risk that falling home prices leads households to put the brakes on spending which ultimately drags consumption and employment growth lower.
A policy “mistake”
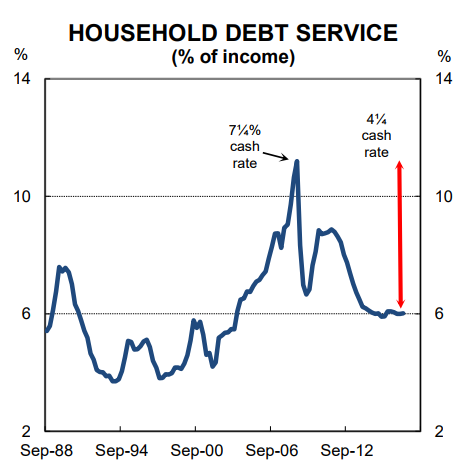
We consider a policy mistake by the central bank to be a risk to the economy given how much debt the household sector is carrying. Specifically, if the RBA hikes too early it could derail the improvement in the labour market that has been underway over the past two years. The record level of debt being carried by the household sector means that interest payments as a share of income will rise quickly if/when rates move higher (chart 13).
We consider a policy mistake to be a risk because the RBA has been overly bullish on wages and the consumer over the past five years (charts 14 & 15).
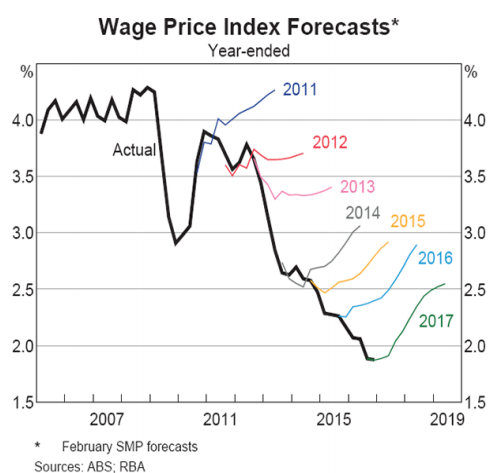
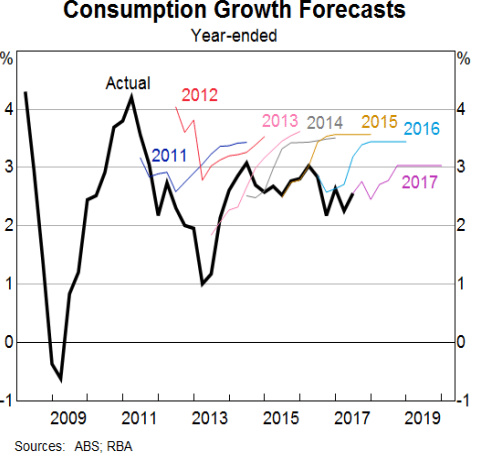
The apparent bias in their forecasts towards a lift in wages and consumer spending means there is a risk that they hike too early if/when wages growth starts to rise.
Here we note that the RBA puts the neutral cash rate at 3.5% which is 200bpts above current settings (this is higher than our estimate of 3.0%). This means that on their own numbers, the RBA would be tightening to 3.5% if it thought the economy was on a sustained path to full employment and inflation at the mid-point of their target band. That to us looks too aggressive and therefore
there is a risk that the central bank hikes too early or too quickly.
A change in immigration policy
Australia’s population growth rate is significantly higher than most other OECD countries. Australia’s population grew by a strong 1.6% (i.e. 373k) in 2016. Net overseas migration accounted for 56% of that increase (chart 16).
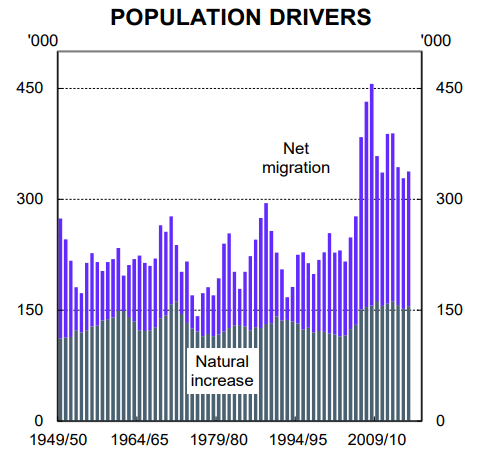
A strong population growth rate boosts the potential growth rate of the economy (not output per person, however) as well as puts upward pressure on dwelling prices through stronger demand for housing. It also, over time, alters the industry composition of the economy (chart 17).
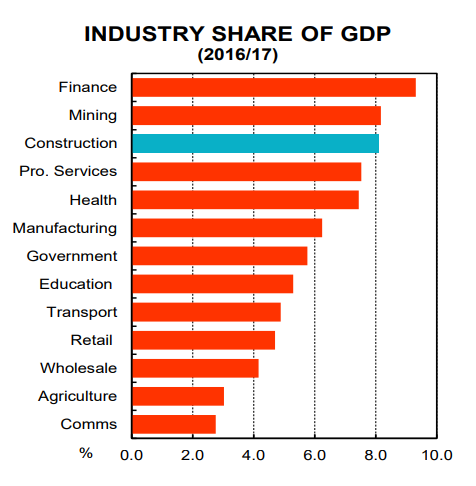
The construction sector in Australia, for example, is proportionately bigger than the construction sector in most other advanced economies because strong growth in people means that more needs to be built – dwellings, roads, schools, hospitals, ports etc. Finally, at the margin, a strong population growth rate at a time when there is labour market slack is likely to be putting downward pressure on wages as workers from offshore add competition to domestic labour.
At present, both major sides of politics (i.e. the Liberal-National Coalition and the Labor party) support maintaining a high permanent migrant intake every year. But there is a risk that one of the major parties opts for a different policy stance. The example here is to be found in New Zealand where there has been a change in immigration policy following the recent election outcome that means migration should drop substantially over the next few years. As a result, a change in immigration policy cannot and should not be ruled out in Australia.
A material reduction in net migration to Australia would increase the risk of a fall in dwelling prices as well as weigh on total output growth (not GDP per capita) and negatively impact the construction sector. But it would also likely put upward pressure on wages growth by reducing the pool of workers in many occupations. In that context, it’s not so much a downside risk, but rather one that would see a shift in the economic outlook that would have both winners and losers. From a policy perspective it’s about assessing whether there is a net societal benefit. But that’s a question for another day.