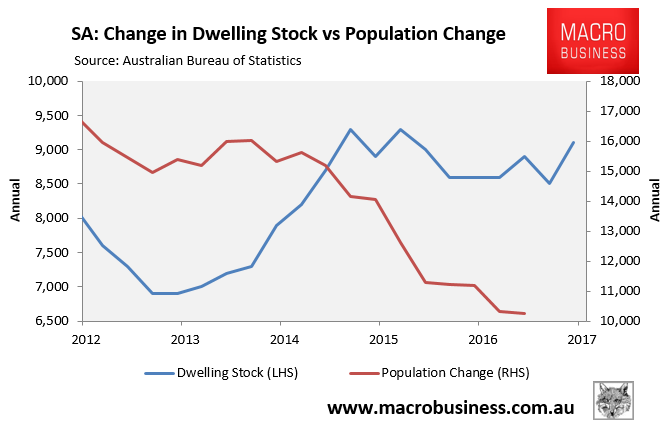
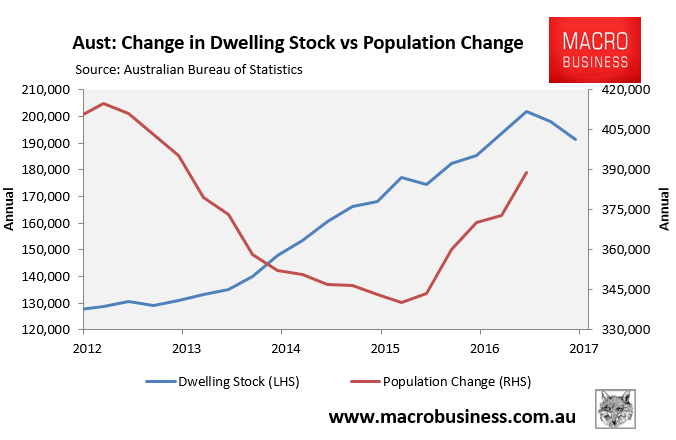
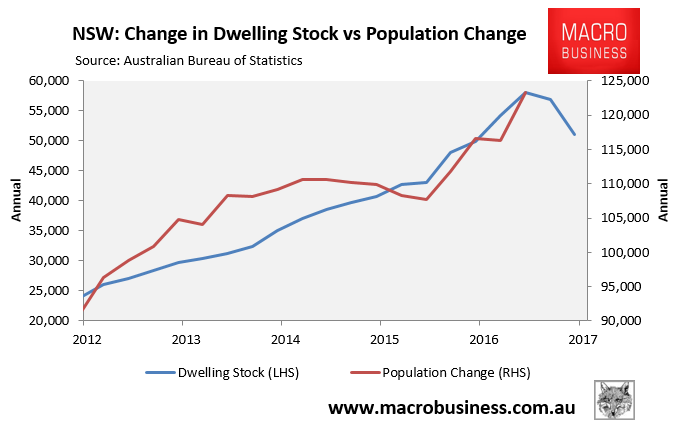
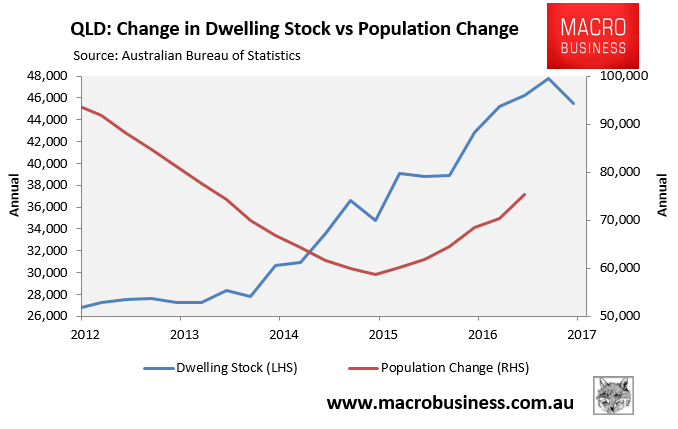
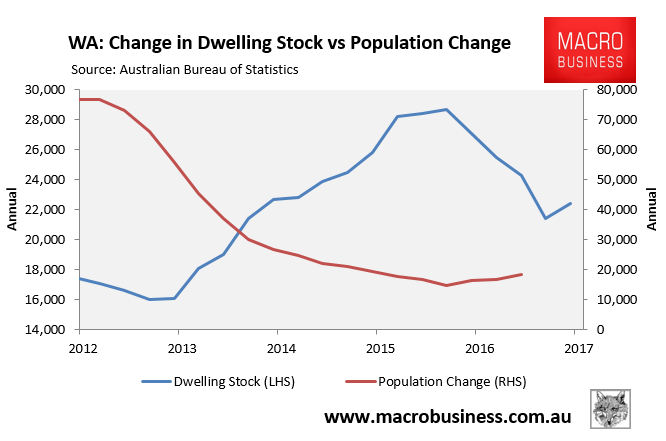
Yesterday’s September quarter property data from the ABS includes a series showing the total number of dwellings in each state. Although this series only dates back to September 2011, it is arguably the best data to use when assessing actual dwelling supply, since unlike the ABS’ various quarterly housing construction data (i.e. approvals, commencements and completions) it takes into account demolitions as well as new additions.
Below are charts plotting annual population change against annual net dwelling additions across each of the major markets:
Advertisement

Advertisement