
By Gareth Aird, Senior Economist at CBA:
Key Points
- The outlook for inflation, wages, the consumer and the housing market suggests that monetary policy tightening looks a long way off.
- The market has ascribed a 50% chance of a rate rise by September 2018.
- We expect the cash rate to stay on hold until Q4 2018. The risk is that we don’t see a rate rise at all next year.
Overview
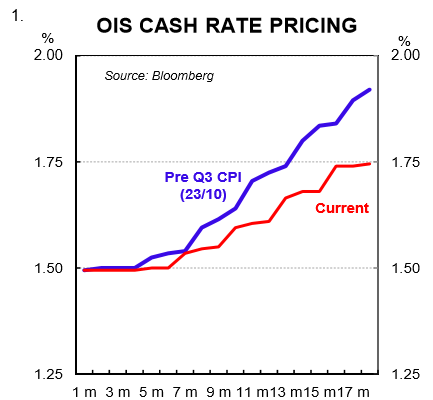
Market pricing for an RBA rate hike has shifted around quite a bit over the past couple of months. In September, after a run of strong employment reports, the market had a rate rise fully priced by September 2018. But more recently, market expectations for a rate hike have receded because of soft wages and inflation data (chart 1). Throughout that period our rate call for policy on hold until late 2018 has remained unchanged.
In this note we flesh out our thoughts on why a rate rise still looks a long way off. There has been a solid improvement in the labour market in 2017. But there are a host of other factors at work that mean a tightening in monetary policy is unlikely to arrive until late 2018 at the earliest. Those factors relate to: (i) slack in the labour market which is suppressing wages growth and inflation; (ii) a stretched consumer; (iii) a slowing housing market; (iv) the outlook for the terms of trade; and (v) the exchange rate.
Wages and inflation
Australia remains stuck in a low wage, low inflation and low interest rate nexus. Decent growth in corporate profits has not translated into higher nominal wages. There are a few reasons for this, but the primary one is that there is plenty of spare capacity in the labour market which reduces the ability of employees to negotiate pay rises.
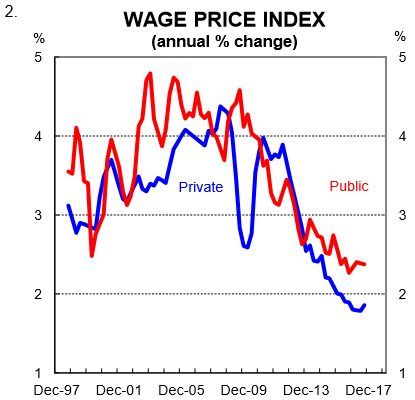
Last week the Q3 Wage Price Index (WPI) was published. The WPI rose by just 0.5% which was a solid miss on expectations for a 0.7% rise. Private sector wages growth remains below 2.0% through the year (chart 2). On the surface a 0.5% lift in wages doesn’t look too bad given the recent past. But a solid lift in the national minimum wage of 3.3%, up from 2.4% the previous year, was in the figures. As a result, it means the pulse of underlying wages growth is particularly weak.
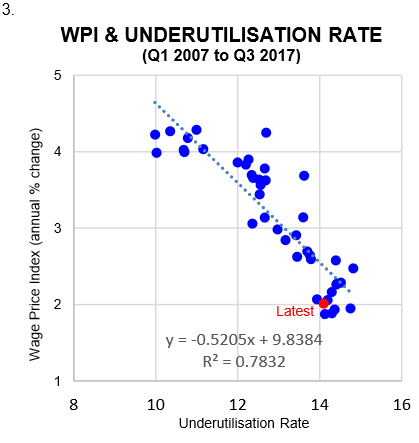
The unemployment rate hit a 4½ year low of 5.4% in October. But underutilisation, defined as the sum of the unemployment and underemployment rates, is still high. A scatter plot (chart 3) shows we remain near the least desirable place – high underutilisation and very low wages growth.
In our view, labour market slack must recede quite a bit further for wages growth to lift. And that will take time given employment growth is likely to ease from its recent red-hot pace.
The impact of declining wages growth as a result of a lift in spare capacity has put downward pressure on inflation. Much like the latest wages data, the Q3 CPI undershot both market and RBA expectations. Both headline (1.8% y/y) and core inflation (1.9% y/y) were below the RBA’s 2-3% target band. And more importantly, the outlook is for low inflation to continue.
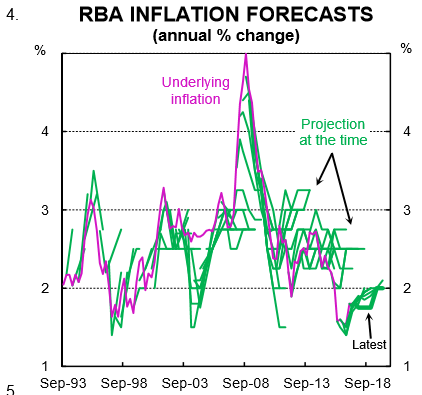
The RBA’s latest forecasts from the November Statement on Monetary Policy (SMP) have core inflation running at 1¾% right through 2018. And it is forecast to be at the bottom of the target band in 2019 (chart 4). These forecasts are lower than the outlook for inflation presented in the August SMP. And while some of the downward revision can be attributed to the upcoming reweighting of the CPI in the December quarter, the bottom line is that the RBA expects core inflation to run below target for another year. It is hard to envisage the central bank tightening policy when their own views on core inflation have it running below their target until 2019.
A stretched consumer
There is plenty of hard and soft economic data that paints the picture of a stretched household sector. Consumer confidence is fragile, household income growth is soft because of weak wages growth, retail sales growth is anaemic and debt sits at a record high as a share of income. But it’s arguably the falling savings ratio that best highlights how the consumer is stretched.
The saving patterns of households can be a big driver of economic activity. The proportion of income saved influences household consumption which is worth 57 per cent of GDP. In Australia, the saving rate1 has been falling since mid2012. This means that expenditure growth over that period has outpaced income growth. As chart 5 shows, household consumption growth has been pretty stable in Australia despite falling wages growth because the saving rate has come down.
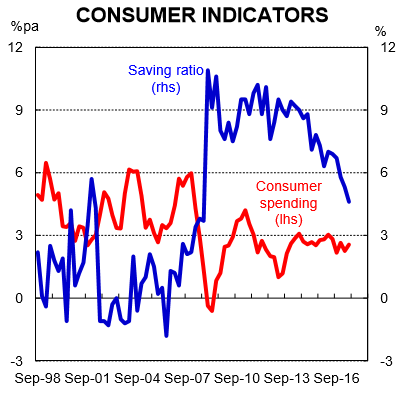
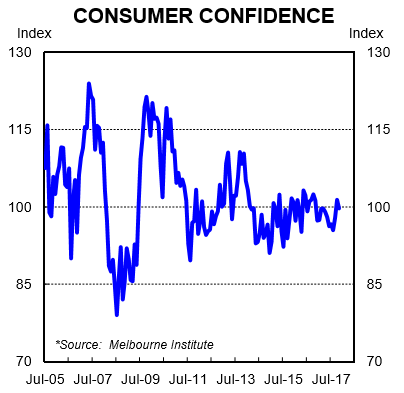
There are two reasons, broadly speaking, why the saving rate may fall. First, consumers may feel good about the future and their personal finances which means they feel comfortable reducing the amount of income that is saved each period. Alternatively, the saving rate may be falling so that households can maintain a constant level of consumption in the face of declining income growth. The evidence suggests that it is the latter situation driving the recent decline in the saving rate. We know this because over the recent past, household income growth has slowed while consumption growth has remained broadly flat. And on top of this, consumer sentiment has been mired in the pessimistic zone for most of 2017 (chart 6).
If the savings rate stops falling, and it must hit a floor at some point, then household income growth and consumption growth will converge. Because wages growth is not forecast to rise sufficiently to propel consumer spending higher, it looks like there are downside risks to the outlook for household expenditure growth. That is not an environment that points to an interest rate hike given higher rates mean a reduction in household disposable income, all else equal.
In fact, the high debt burden faced by the household sector in Australia means that any rate hike will have a bigger impact on household finances than at any other time in our history.
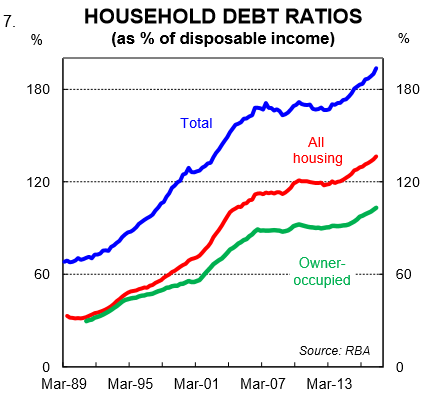
Debt to income has risen from around 148% in mid-2012 to a record high of 194% in Q2 2017 (chart 7). That puts Australia in the top tier of household indebtedness globally. This measure includes all households regardless of whether they actually have a mortgage. For households that have a mortgage, that figure is closer to 300%. It has increased steadily as interest rates have come down despite lower rates making it easier to repay debt. Basically growth in the net flow of credit (i.e. new credit less repayments) has been higher than growth in income thus pushing up leverage.
A high debt burden relative to income is constraining household consumption growth. Basically, an increase in debt relative to income means households have borrowed from the future to consume in the present. If debt is to fall as a share of income then households will need to reduce consumption as a share of income in the future. This can have major economic consequences if/when the long term debt cycle unwinds.
A slowing housing market
Conditions in the Australian housing market have at times had an influence on RBA rate decisions. Back in 2014, for example, Glenn Stevens (RBA Governor at the time), said that, “while we may desire to see a faster reduction in the rate of unemployment, further inflating an already elevated level of housing pr ices seems an unwise route to try to achieve that” . Of course history will show that the RBA did cut rates over the subsequent two years which did further inflate the housing market. But the point to note is that the pace of dwelling price appreciation played a role in the timing of some rate decisions. Had dwelling price growth been softer the RBA would have probably cut rates more aggressively to support the economy as unemployment lifted to 6¼%.
More recently, in February 2017, current RBA Governor Lowe said, “ the main effect (of another rate cut) would be more borrowing for housing, pushing up housing prices.” That’s true. But a rate cut would have also lessened the debt burden faced by households that carry debt. And it would have put downward pressure on the exchange rate which is beneficial to the economy when you are trying to engineer a lift in growth. It would have been possible to both slow dwelling price growth as well as reduce the debt burden faced by households with more stringent macro prudential policies. But that’s a conversation for another day. At this juncture, we are interested how developments in the housing market from here may impact on rate decisions. And here the evidence suggests that the housing market is cooling which does not add support to the case for a rate hike when wages growth is so soft.
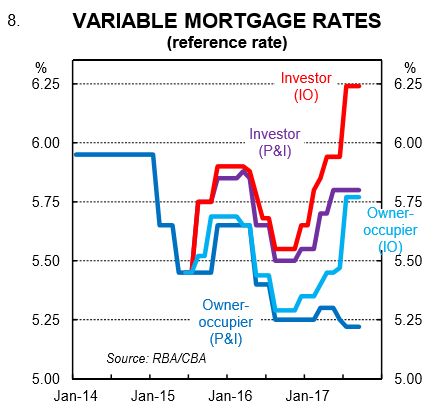
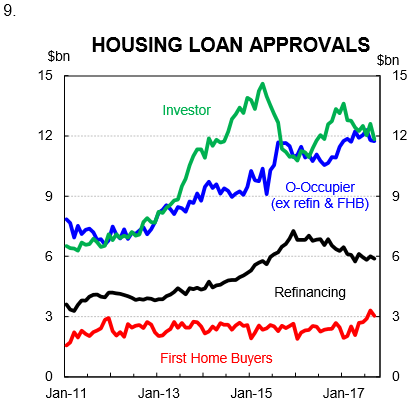
A range of indicators point to a continued softening in dwelling price growth over the next year. Moves by lenders earlier in the year in response to measures announced by APRA resulted in a lift in mortgage rates on interest only loans (chart 8). This has led to a slowdown in lending growth to investors (chart 9).
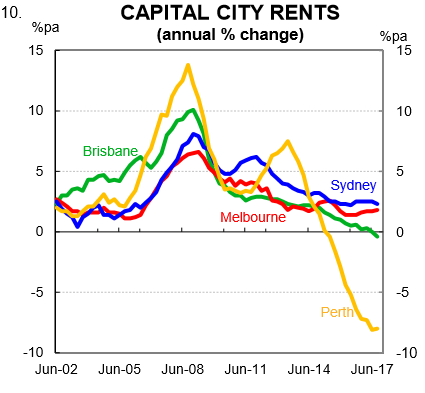
Growth in rents remains particularly soft as evidenced in the Q3 CPI. Rents in Brisbane, for example, declined through the year (chart 10). And with plenty of supply to hit the market over the next two years, a further decline in rents in Brisbane looks more likely than not. This is not a backdrop that is supportive of dwelling price growth.
There are some other factors working in particular regions that should also have a dampening impact on dwelling price growth. State Government stamp duties levied to foreign investors rose to between 7-8% in both NSW and Victoria in the middle of the year. Good policy in our view, although it would have been beneficial to bring it in earlier.
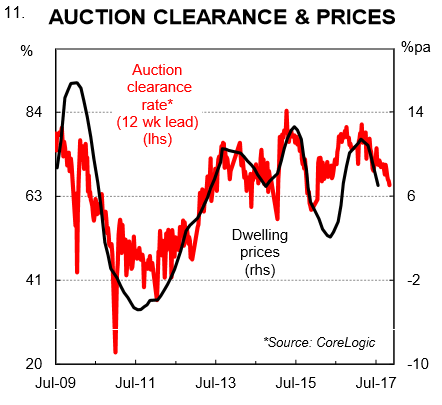
One of the more accurate near term leading indicators of dwelling prices is auction clearance rates. At a national level, these have eased from near 80% in May to have averaged out at around 65% so far in November.
The upshot of these developments is that it raises the bar a little for a rate hike just like the overheated housing market raised the hurdle for rate cuts over the previous few years. Conversely, it lowers the bar for a rate cut should the labour market falter.
The terms of trade and nominal GDP
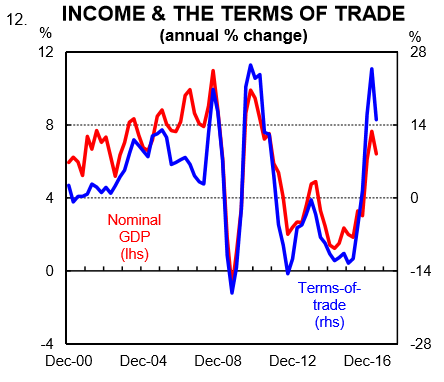
Higher commodity prices throughout 2016/17 generated a healthy lift in both the terms of trade and nominal GDP (chart 12). In the year to Q2 2017 (latest data available) the terms of trade was 14.8% higher through the year while nominal GDP growth was running at 6.4% y/y. Basically the economy had a positive income shock because of a lift in bulk commodity prices. Most of that income windfall didn’t make its way to household sector. But it did show up in higher corporate profits and a solid lift in government revenue. That story, however, has shifted recently.
Commodity prices and therefore the terms of trade fell over both Q2 and Q3 2017. Our model puts the terms of trade down by 1.6% over the September quarter. It will weigh on national income growth and the impact will be evident when the national accounts print on 6 December.
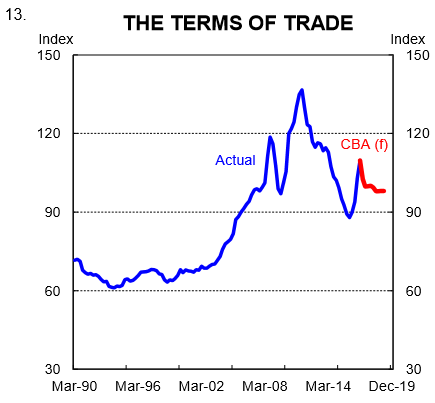
Looking further ahead, our expectation for a further easing in commodity prices means that we expect the terms of trade to trend lower over the next few years, but to remain above its trough in early 2016 (chart 13). As a result, nominal GDP growth should ease which means that the Federal Budget will remain under pressure because growth in tax receipts will slow.
From a rates perspective it means that the economy will have an income headwind to deal with. Some of that will be offset by higher export volumes. Notwithstanding, a further easing in the terms of trade will act as a disinflationary force thus making a rate hike less likely.
The Aussie dollar
Finally we come to the exchange rate. The RBA has talked about the risk of a higher AUD on the economy regularly over the past few years. Most recently in November, the Governor said in his Statement accompanying the no change decision that, “the higher exchange rate is expected to contribute to continued subdued price pressures in the economy. It is also weighing on the outlook for output and employment. An appreciating exchange rate would be expected to result in a slower pick – up in economic activity and inflation than currently forecast. ”
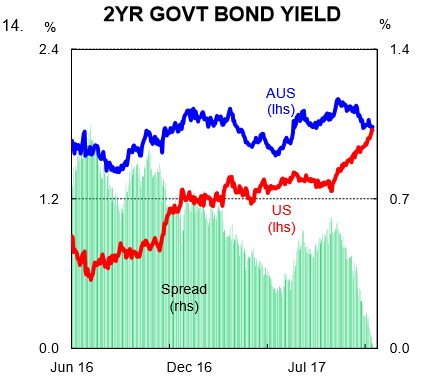
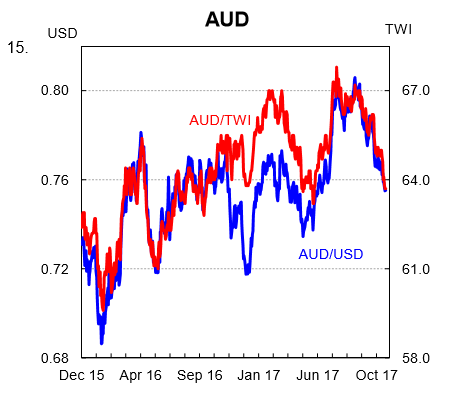
The RBA cannot influence commodity prices. But it can impact the front of the yield curve which is a driver of the AUD. Over the past few weeks a solid narrowing in the Australia/US two year bond spread has put downward pressure on the AUD (charts 14 and 15). The AUD is currently trading at a fourmonth low against the USD and we very much think that the RBA will welcome this development. By leaving policy unchanged over the next year and not raising expectations for a rate hike (as was the case last night when the Governor spoke), the downward pressure that is being applied to the AUD through a narrowing in spreads can be maintained. We think that this is the strategy that the RBA will take while inflation and wages growth remains low.
The real economy
This note has clearly focused on the reasons why a rate hike looks unlikely for at least a year. As such, it hasn’t discussed any of the more positive trends in the economy lately. To be clear, we expect the labour market to continue to tighten and we have GDP growth lifting to 2¾% in 2017/18. The business surveys suggest that non-mining investment will lift a little. And public investment will make a decent contribution to growth. As a result, the activity side of the economy should look reasonable over the next year. But in our view it will not be strong enough to generate the type of lift in wages or inflation that justifies a rate hike. Calls for policy tightening look premature, in our view, and we don’t think a rate hike realistically enters the fray until late 2018. The risk is that we don’t see a rate rise at all next year.