CoreLogic’s Cameron Kusher has penned a blog post showing how housing affordability worsened over the June quarter, driven by Sydney and Melbourne:
The latest data to June 2017 indicates that, despite the cash rate remaining stable at record lows, housing affordability has generally worsened over the most recent quarter. The changes in affordability at a national level are detailed below:
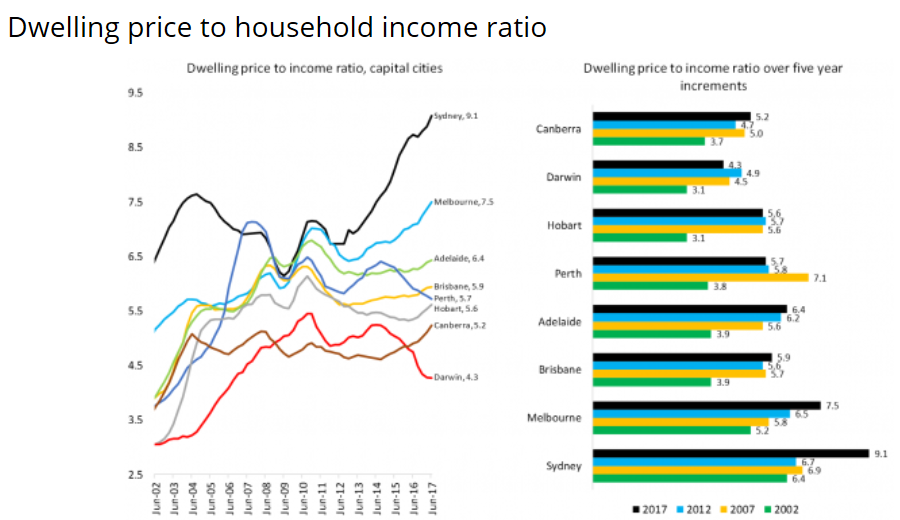
Dwelling price to household income ratio The national dwelling price to household income ratio was recorded at 6.8 in June 2017, with a higher ratio for houses (7.0) compared with units (6.3). The ratio increased over the quarter for houses and units however, 15 years ago the ratios were much lower at 4.5 for houses and 5.1 for units. The measure for houses is currently at an historic high while for units it has moderated slightly from a high of 6.5 in early 2015.
Years of household income required for a 20% deposit A 20% deposit was equivalent to 1.36 years of gross household income at the end of June 2017, with the figure recorded at 1.40 years for houses and 1.26 years for units. At the same time in 2002 it took 0.92 years to save a 20% deposit, 0.89 years for houses and 1.02 years for a unit. As the cost of housing has increased and household income growth has slowed it has become increasingly challenging for some segments of the market to raise a 20% deposit which has required a longer period of savings in order to enter the housing market.
Proportion of household income required to service an 80% LVR mortgage At the end of 2016-17 financial year it took 36.2% of the median gross annual household income to service a mortgage, with the proportion higher for detached houses (37.2%) and lower (33.7%) for units. Although mortgage rates have fallen over the past year, the ongoing increases in dwelling prices and low level of household income growth means serviceability has deteriorated. Despite the higher reading over the June quarter, mortgage serviceability is currently at similar levels to what was recorded in early 2004, highlighting how lower interest rates have made it easier for home owners to service and pay off their mortgage debt.
Proportion of gross annual household income required to rent a home Over the past 15 years there has been very little movement in the proportion of household income required for rent. This highlights that increases in rental costs are constrained by movement in household incomes. At the end of June 2017, 27.6% of the median gross annual household income was required to pay rent with the figures similar for houses (27.2%) and units (27.6%) across the country. The data also highlights that despite historic low interest rates, it generally remains cheaper to rent than to take out a mortgage in many areas…
The full text of this article is available to MacroBusiness subscribers
Leith van Onselen is Chief Economist at the MB Fund and MB Super. He is also a co-founder of MacroBusiness.
Leith has previously worked at the Australian Treasury, Victorian Treasury and Goldman Sachs.