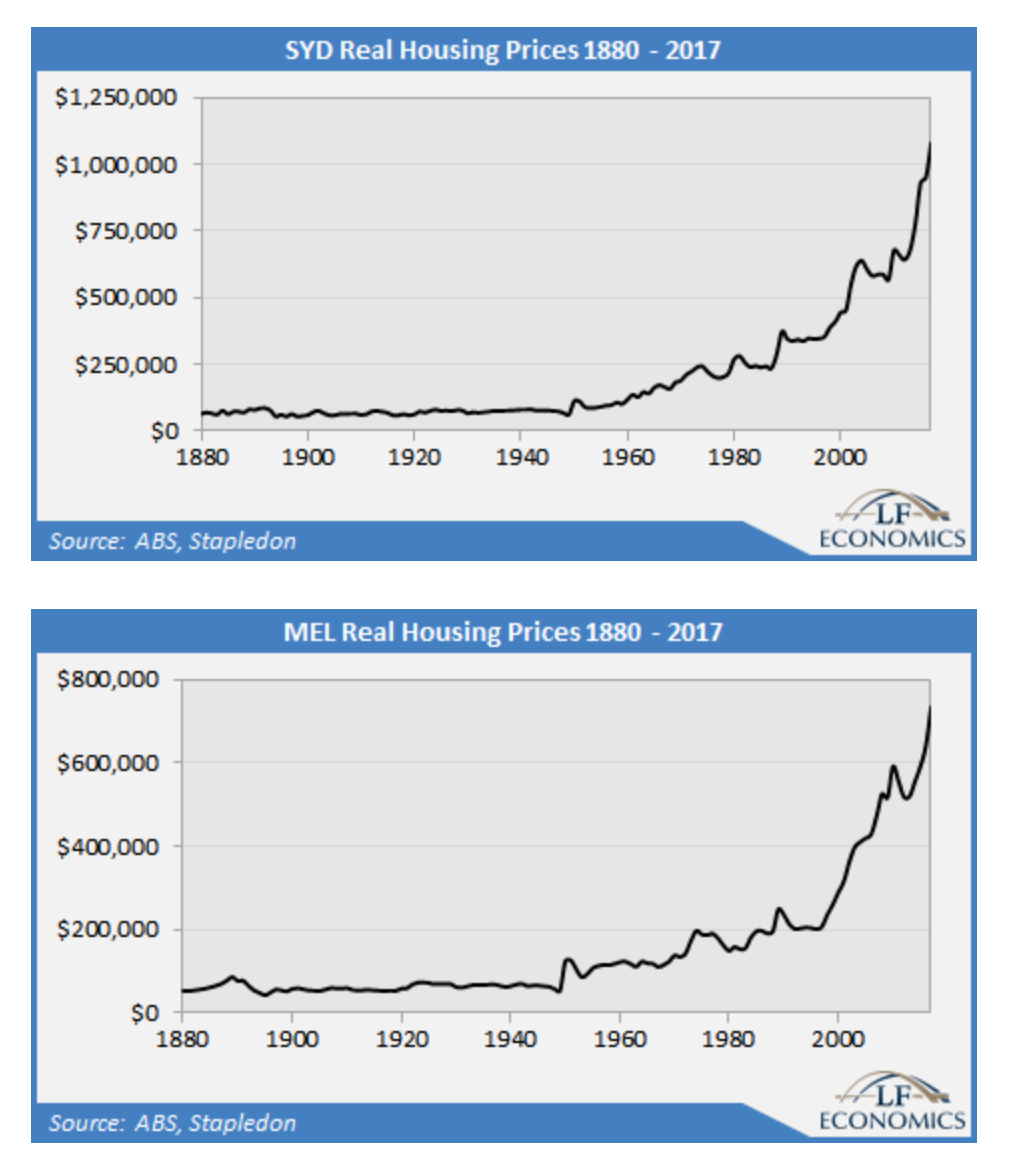
While our long-term charts on the housing market are often presented as indexes, it would be an interesting exercise to see the trends in prices over time. Real housing prices in Sydney and Melbourne were steady over the period 1880 – 1949, and then slowly increased over the decades during the social democratic period.
The strong rise in housing rents underpinned this price growth in large part, which in turn was due to the strong rise in real wages and hence household income in the post-WW2 era. The two depressions of the 1890s and 1930s, combined with the two World Wars, was not so conducive to wage and household income growth. In contrast, households have fared much better in the post-WW2 period.
From the mid-1990s onward, real housing prices have tripled in Sydney and almost quadrupled in Melbourne. The other capital cities also experienced strong price growth during the 2000s but have tapered off after the GFC. In a rent-seeking economy like Australia where vested interests have more influence over our politicians relative to the public, they have achieved vast gains to date. After all, land is considered to be a profit centre to maximise, not a cost centre to be minimised.
In the context of these price rises, the real estate lobby staunchly promotes population growth (population quantitative easing or PopQE) to further stimulate housing demand. Ironically, while government and industry claim high housing prices are due to a dwelling shortage, they keep on supporting PopQE.
The extreme levels of household debt, growing at around 6 per cent annually while income growth stumbles along at 2 per cent, indicates a persistently rising debt to income ratio. This would not be necessarily bad news for property investors were it not for the rising interest rates on interest-only loans and stagnating rents nationwide.
Rents are plummeting in Perth and Darwin, and tracking sideways in the other capital cities, except for Sydney and Melbourne, where they are growing slightly above the inflation rate. Despite PopQE, rents are rising a little but not resulting in a significant surge as has occurred in the past.
Government and industry have cornered themselves to an extent here. While PopQE increases housing demand as indicated by the supply-demand index which is strongly correlated to rents, it tends to hold down the other determinant of rent growth: wages.
This is why a large increase in nominal rents for Sydney and Melbourne is unlikely to occur any time soon even as PopQE runs at full steam. Immigrants flooding into these two cities will likely have the effect of holding down wage growth. Indeed, Australia is currently in the spell of the lowest nominal wage growth in post-WW2 history, even more so than the early 1990s recession.
The combination of rising household debt, low rent growth and increasing interest rates for IO loans is not a good outcome for investors, especially those at the margin. Even worse, the forced conversion of IO to P&I can cause annual debt payments to rise significantly.
In aggregate and at the margin, housing investment results in a negative carry, which must be covered and then exceeded by housing price growth to maintain profitability, and then only on paper. For an investment class, the financials are terrible. Over the last two decades, however, this has not proved overly problematic for those in Sydney and Melbourne due to the enormous housing price growth.
Given the negative carry, it is somewhat amusing to see what the bear cases for property investment are. Investors do not have to experience a US-style housing implosion to be stuck up a certain creek without a paddle; even a moderation in housing price growth will do that for them. The third or so of investors who are positively-geared need not worry, except for opportunity costs relative to other asset classes.
Bear case: annual positive housing price growth that matches the cost of the negative carry;
Strong bear case: annual positive housing price growth that does not meet the cost of the negative carry;
Annihilation: persistence of any of the above cases.
Australia has the world’s second-highest household debt to GDP ratio (122%), second equal-highest household sector debt service ratio (with Denmark at 15.4%) and fifth-highest household debt to income ratio (172%; BIS compatible). Accordingly, investors will have to keep on praying that other households will be stupid enough to take upon even more debt than they did to inflate prices further.
The government just recently passed the latest housing policy stimulant by allowing FHBs to access their superannuation on the pretext of allowing easier entry into the housing market. If there were any honesty in government and industry, it should be called the Mandated Housing Price Increase Act (2017) or the Save our Mates Act (2017). This is truly like squeezing the juice out of the pulp of oranges to extract every last drop.
Yet the household debt runaway train continues to keep on going, despite the poor fundamentals supporting further leverage. Then again, there has never been any fundamentals to support such an enormous run-up in household debt. Declining nominal interest rates are often cited as a reason, but the fact that the only way for property investors to win in such a zero-sum game market is to sell for a profit and walk away from the market altogether. Re-entering the market defeats the purpose of trying to profit in a market that offers no substantial yield.
Aspiring home owners are well and truly stuffed, given they face enormous debts to enter the market and extremely poor wage growth. This is an important observation, given how these two variables coincide with each other: new owners need strong wage growth to inflate away debt payments. This is why the baby boomer generation had it so good: low debts and high wage growth resulted in very affordable housing.
Every vested interest is praying Australia’s dream economic run without a recession continues, for given the toxic levels of household debt, low wage growth, unemployment above 5%, the highest underemployment on record, no productivity-enhancing reform, a government dedicated to class and generational warfare, rising energy costs and some of the lowest social welfare spending in the OECD, a recession would be as welcome as much as the Black Plague.
David Llewellyn-Smith is Chief Strategist at the MB Fund and MB Super. David is the founding publisher and editor of MacroBusiness and was the founding publisher and global economy editor of The Diplomat, the Asia Pacific’s leading geo-politics and economics portal.
He is also a former gold trader and economic commentator at The Sydney Morning Herald, The Age, the ABC and Business Spectator. He is the co-author of The Great Crash of 2008 with Ross Garnaut and was the editor of the second Garnaut Climate Change Review.