The Australian’s Henry Ergas has penned an article today attempting to debunk Labor’s and the ACTU’s claim that Australian workers are getting less of the economic pie:
If you listened to Bill Shorten and Sally McManus, you would think real wages were falling behind productivity growth, depriving workers of their fair share of the pie.
In reality, real wages and productivity have been rising hand-in-hand, with both increasing by almost exactly 40 per cent over the period from 1996 to 2016.
You would also think labour’s share of national income had been plummeting, as profit rates rise at workers’ expense. But labour income share has been trending up since 2009, which contrasts with what is happening in most advanced economies.
Yes, labour’s share of national income, which is more than twice that of capital, is a few percentage points lower than it was in the mid-1990s, while capital’s is a bit higher. But that is not because profit rates have increased: on the contrary, the rate of return on capital has fallen…
Last but not least, you would think we were hurtling towards a dystopia in which the rich get richer as the poor sink into misery, with the ACTU claiming on Tuesday that “rising inequality is forcing working people into poverty”.
In reality, as the Australian Bureau of Statistics’ survey of income and housing showed just 24 hours after the ACTU released its purple prose, household incomes are rising much more rapidly at the bottom of the income distribution than at the top.
And the ABS’s estimate is confirmed by the Melbourne Institute’s Household, Income and Labour Dynamics in Australia survey, which finds that the real incomes of the poorest 10 per cent of households have risen by 38 per cent since 2001, while those of the uppermost 10 per cent have increased by only 30 per cent.
As a result, far from soaring (as the ACTU claims), the Gini coefficient — a standard measure of income inequality, whose value rises from zero to one as the income distribution becomes more unequal — is no higher today than it was at the turn of the 2000s.
While there might be some truth to some of Ergas’ claims, the picture is nowhere near as rosy for workers as he makes out.
Advertisement
Consider the below long-run charts from the June quarter national accounts.
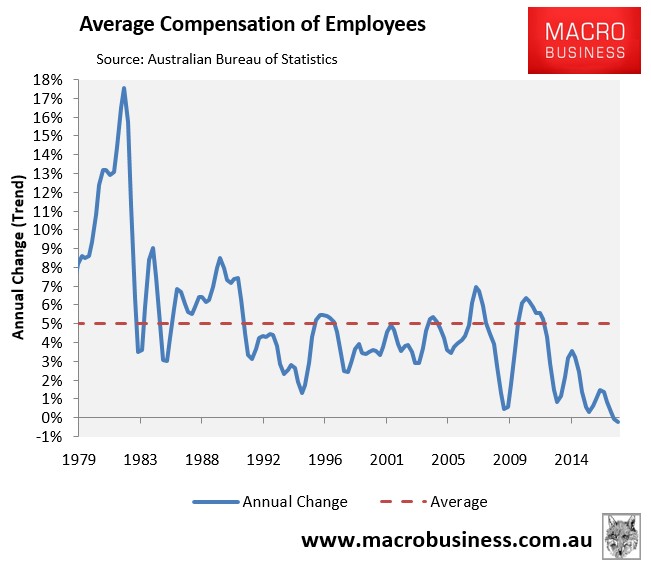
First, the average compensation of employees fell by 0.2% over the year to June 2017 – the lowest annual growth recorded in the series’ history:
Advertisement
Adjusting for inflation, the situation facing Australian workers is even worse, with average compensation falling by 2.1% over the year.
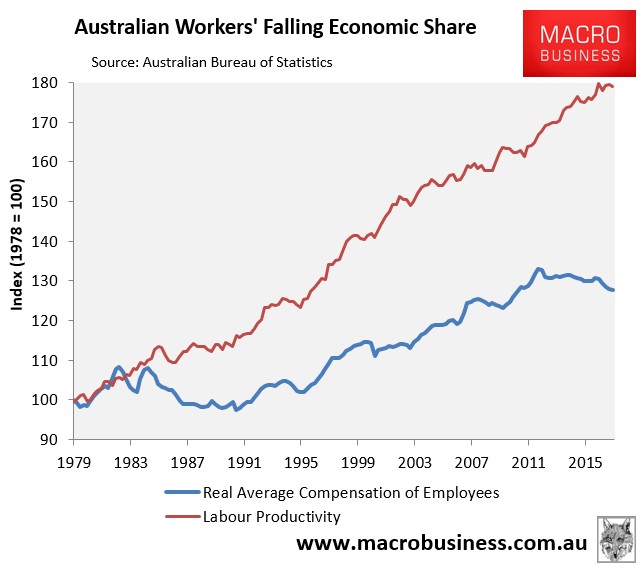
Second, the slump in workers’ compensation comes despite solid increases in labour productivity. As shown in the next chart, real average compensation of employees has badly lagged labour productivity since the early-1980s, however, the divergence has become especially stark over the past five years:
Advertisement
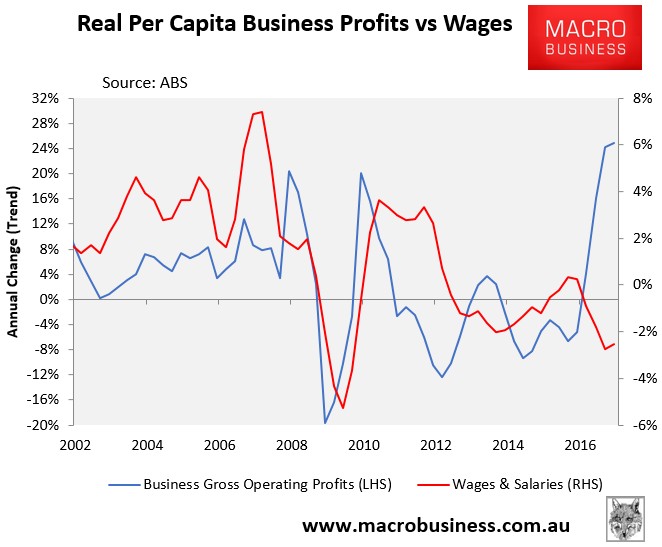
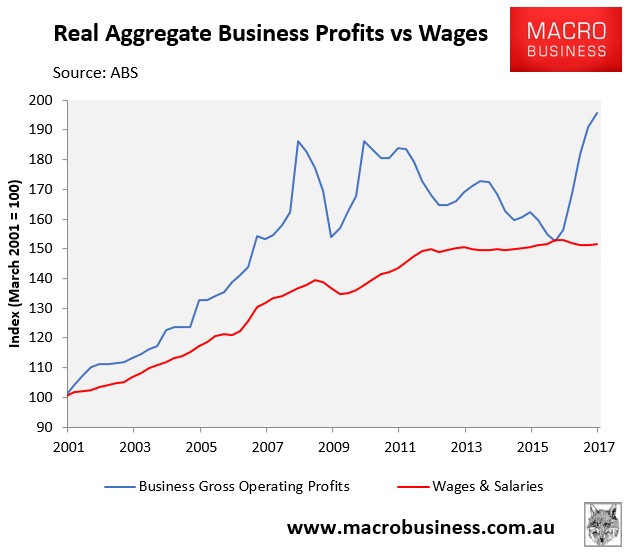
Third, company profits have boomed just as workers’ incomes have declined:
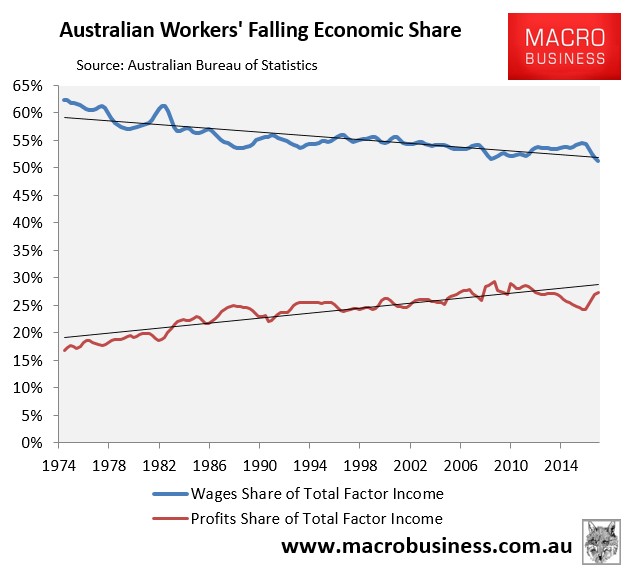
Fourth, the wages share of total factor income has hit the lowest level since June 1964 (53 years):
Advertisement
Clearly, the above data backs Labor’s and the ACTU’s claims that Australian workers are receiving less of the national economic pie.
Ergas’ claim that the lowest income earners have received higher earnings growth than high income workers may be true. But what about their costs?
Advertisement
Data released this week by CoreLogic revealed that the lowest-priced segments of the housing market have increased in cost far more quickly over the past 30 years than expensive homes, squeezing housing affordability for ordinary workers:
Over the period shown, August 1987 to August 2017, the thirty year period has seen values across the most affordable 25% of properties rise 1,517% compared to increases of 580% across the middle 50% of suburbs and 432% across the most expensive 25% of suburbs. This highlights how affordability has deteriorated substantially at the more affordable end of the housing market.
Wealth inequality, as measured by the Gini coefficient, is the same now as it was in 2013-14 (0.605), but higher than when it was first comprehensively measured in 2003-04 (0.573)…
“In 2015-16, the wealthiest 20 per cent of households held more than 60 per cent of all household wealth, now averaging $2.9 million per household.
“By comparison, those in the middle 20 per cent held 11 per cent of all household wealth, averaging $528,400 per household in 2015-16. The lowest 20 per cent controlled less than 1 per cent of all household wealth, with average wealth currently at $36,500.”
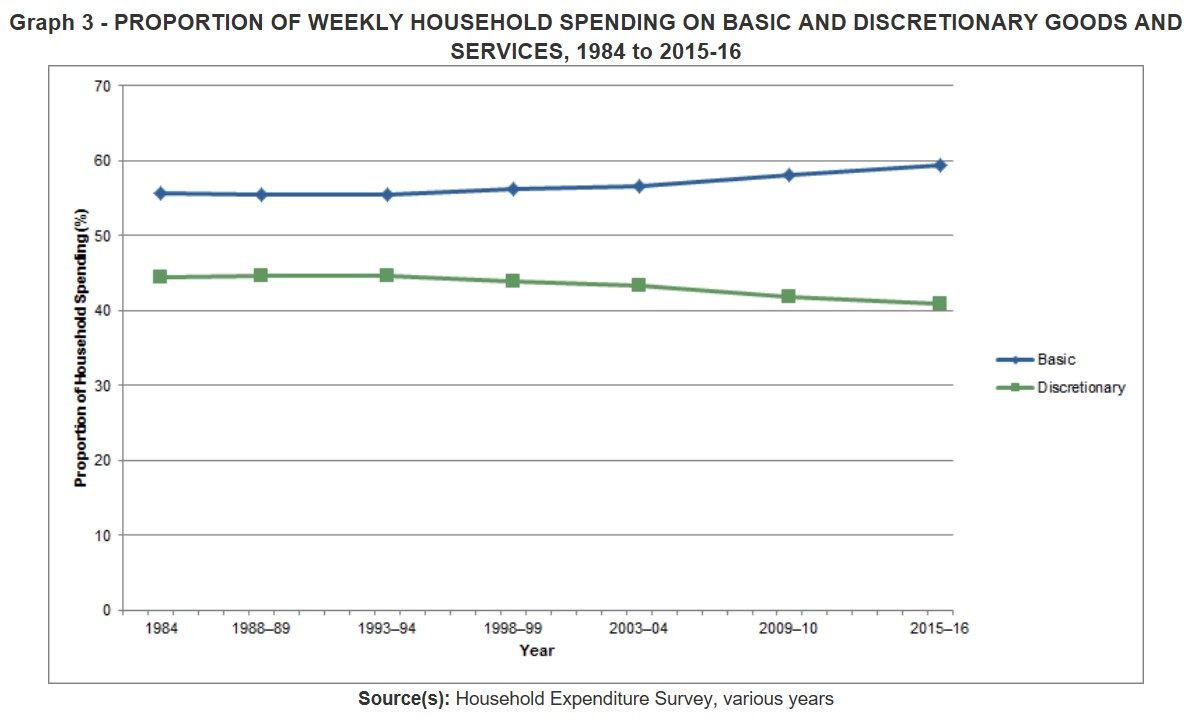
More than half the money Australian households spend on goods and services per week goes on basics – on average, $846 out of $1,425 spent – according to the 2015-16 Household Expenditure Survey (HES), released today by the Australian Bureau of Statistics (ABS).
“We can broadly think about household spending as either being for ‘basics’ or for ‘discretionary’ purchases – with basics covering essentials such as housing, food, energy, health care and transport,” ABS Chief Economist, Bruce Hockman said.
Today’s release shows that a growing portion of weekly outlays is spent on basics. Spending on basics accounted for 56 per cent of weekly household spending in 1984, growing to 59 per cent in 2015-16.
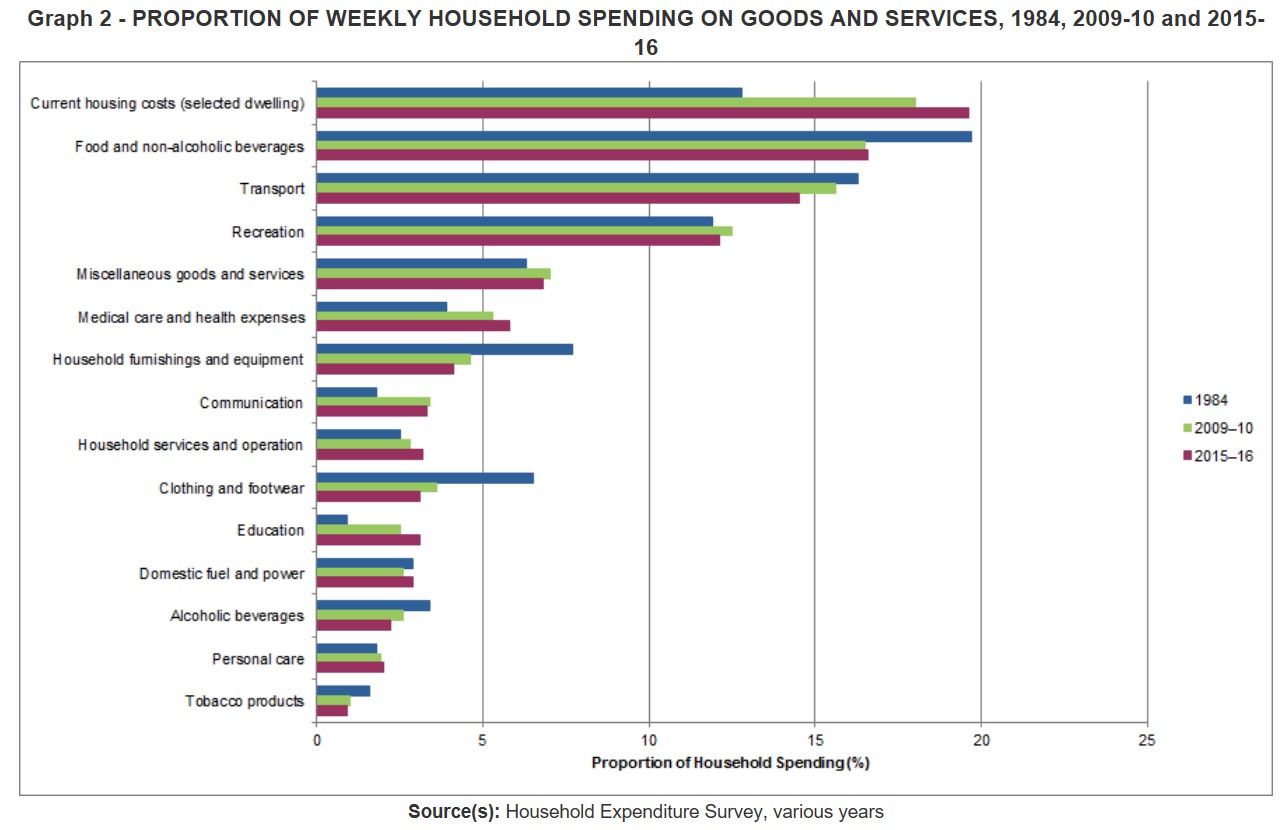
“The survey also shows that since 1984, the pattern of household spending has changed considerably,” explained Mr Hockman.
“In 1984, the largest contributors to household spending were food (20 per cent), then transport (16 per cent) and housing (13 per cent).”
“Jump forward to 2015-16, and housing is now the largest contributor (20 per cent), followed by food (17 per cent), and transport costs (15 per cent).”
Advertisement
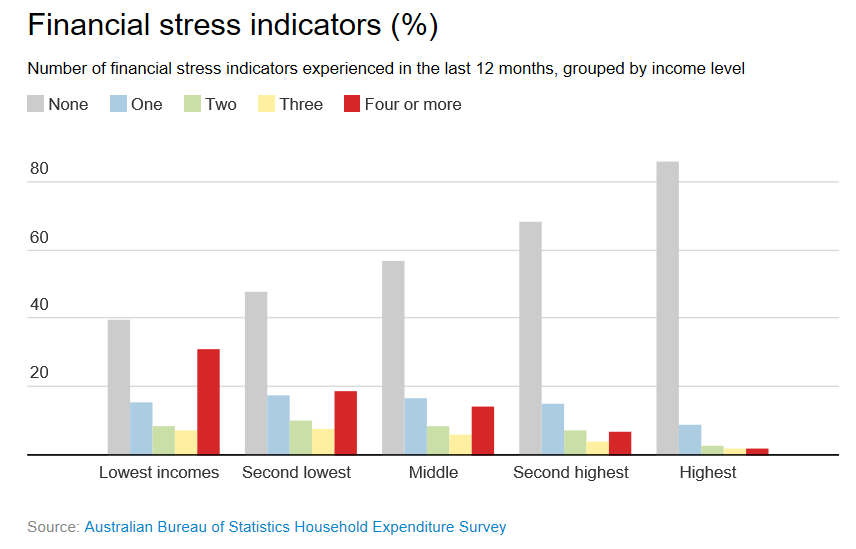
The situation is worst for lower income earners, with the ABS’ Household Expenditure Survey finding that one in every two households with incomes in the bottom 40% are experiencing at least one indicator of financial stress:
None of this paints a rosy picture for ordinary Australian workers, does it?
Leith van Onselen is Chief Economist at the MB Fund and MB Super. He is also a co-founder of MacroBusiness.
Leith has previously worked at the Australian Treasury, Victorian Treasury and Goldman Sachs.