Advertisement
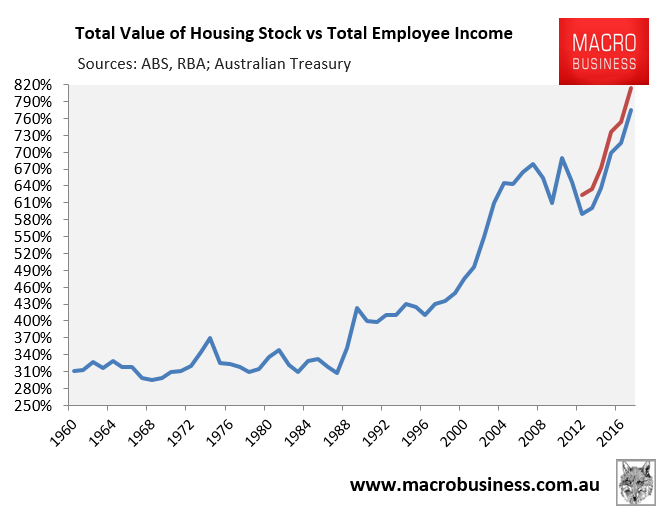
The ABS on Tuesday released its property price data for the June quarter, which valued Australia’s dwelling stock owned by households at a record $6.39 trillion, whereas the total housing stock was valued at a record $6.73 trillion.
As shown below, the total value of Australia’s dwelling stock owned by households was an all-time high 7.7 times employee incomes as at June 2017, up from 7.2 times incomes a year prior, whereas the total housing stock was valued at 8.2 times employee incomes:
Advertisement
The full text of this article is available to MacroBusiness subscribers
Cancel at any time through our billing provider, Stripe
About the author

Leith van Onselen is Chief Economist at the MB Fund and MB Super. He is also a co-founder of MacroBusiness.
Leith has previously worked at the Australian Treasury, Victorian Treasury and Goldman Sachs.
Advertisement