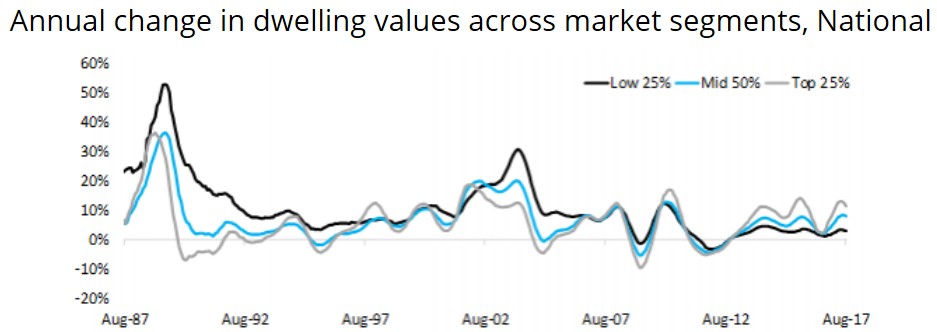
CoreLogic’s Cameron Kusher has written an interesting article showing that the most expensive 25% of the market has experienced the strongest price growth over the past year, although over the long-run lower priced segments have risen the strongest in value [my emphasis]:
Over the 12 months to August 2017, the most affordable 25% of residential properties nationally have recorded value growth of 2.9% compared to growth of 8.0% across the middle 50% of suburbs and 11.4% growth across the 25% of most expensive suburbs…
Over the period shown, August 1987 to August 2017, the thirty year period has seen values across the most affordable 25% of properties rise 1,517% compared to increases of 580% across the middle 50% of suburbs and 432% across the most expensive 25% of suburbs. This highlights how affordability has deteriorated substantially at the more affordable end of the housing market.
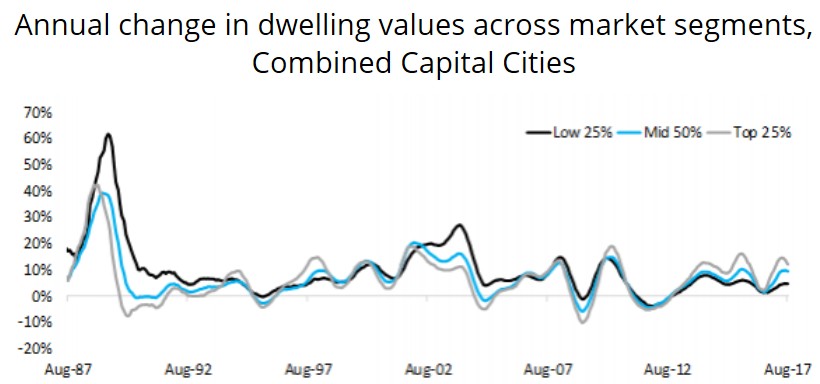
The second chart shows the change in values across the three broad segments throughout the combined capital cities. Over the 12 months to August 2017, the most affordable 25% of properties have recorded growth of 4.6% compared to 9.3% growth across the middle 50% of properties and a 12.2% change across the most expensive 25% of the market. Like the national figures, in the event of a housing market downturn it has been the more expensive housing which has tended to see the greater value falls…
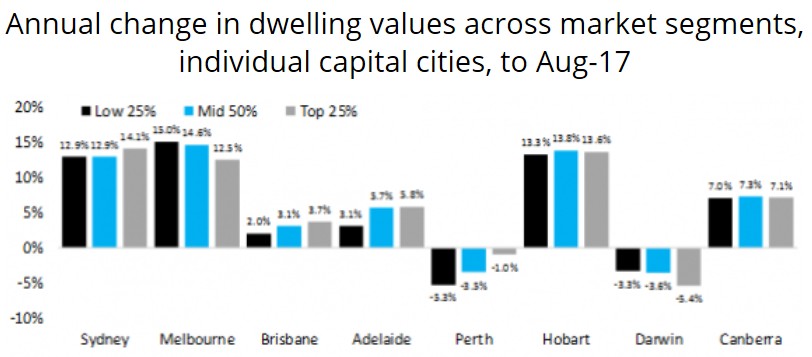
The final chart shows the annual change in dwelling values across the three market segments throughout the capital cities. Melbourne and Darwin are the only capital cities that have recorded the greatest change in values over the year across the most affordable suburbs and the slowest growth across the most expensive suburbs.
Leith van Onselen is Chief Economist at the MB Fund and MB Super. He is also a co-founder of MacroBusiness.
Leith has previously worked at the Australian Treasury, Victorian Treasury and Goldman Sachs.