By Leith van Onselen
The Reserve Bank of Australia (RBA) last week released a new report examining why the circulation of Banknotes continues to grow strongly – especially high denomination notes – despite falling demand for cash among consumers:
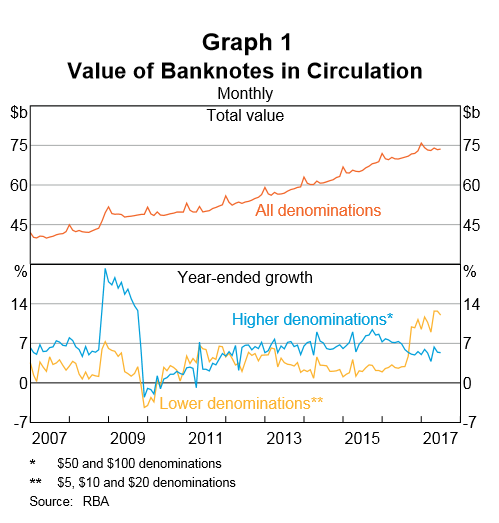
Growth in the value of banknotes in circulation has been broadly steady at around 6 per cent per annum for more than a decade.1 Currently, the total value of banknotes in circulation is around $74 billion (Graph 1). Growth is evident in all denominations, although growth in demand for the higher denominations has generally outpaced that of the lower denominations over the past 10 years.
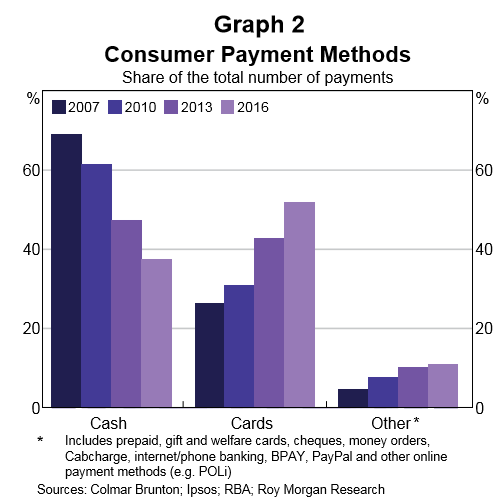
At the same time, evidence from the Reserve Bank’s triennial Consumer Payments Survey (CPS) indicates that the share of payments (by number) made with cash has fallen substantially over the same period.3 In 2007, around 70 per cent of consumer payments were made with cash. This fell to around 37 per cent in 2016 (Graph 2)…
The size of the economy is the most important driver of banknote demand, with a 1 per cent increase in nominal GDP associated with a 1 per cent increase in cash demand over the long term. While an increase in nominal GDP raises demand for all denominations, its impact is greatest on the higher denominations. Nominal GDP simultaneously captures the effect of population growth, inflation and real income growth, which suggests that these factors are important drivers of cash demand. In fact, these three factors can explain much of the growth in circulation over the past 10 years…
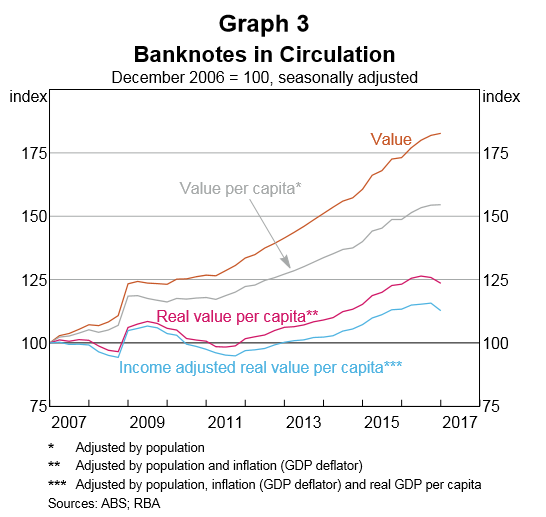
Compared with the total value of banknotes in circulation, the income adjusted real value of banknotes per capita in circulation has increased quite slowly over the past 10 years: around 1 per cent per annum, on average. This suggests that the value of banknotes in circulation has grown broadly in line with the Australian economy. Nevertheless, even this may seem surprising given the extent of the shift away from cash as a payment method indicated by the CPS…
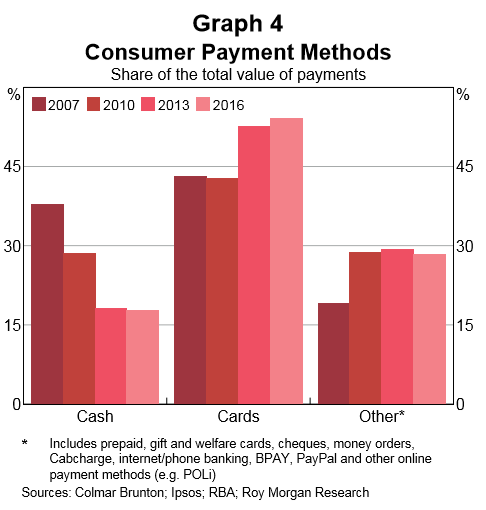
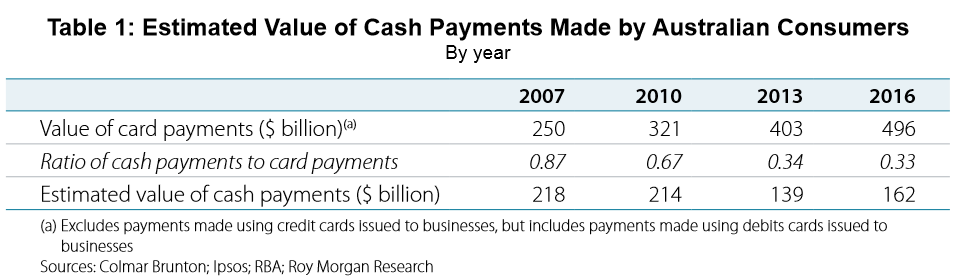
The CPS data can be used to calculate each payment method’s share of total payments by value (Graph 4). Cash payments comprise a smaller share of total payments when measured by value than by number. This is because cash is more commonly used in low-value payments. The share of cash payments by value has fallen since 2007, but was stable between 2013 and 2016 at around 18 per cent.
… total cash payments made by Australian consumers is estimated to have fallen by around one-quarter between 2007 and 2016 (Table 1).5 Importantly, because total payments have increased – due to factors such as population, inflation and income growth – the fall in the total value of cash payments has not been as large as what is suggested by the changing share of cash payments, which declined by more than half.
…the CPS does not cover cash use by businesses, nor is it likely to fully capture the use of cash in the shadow economy (e.g. to avoid reporting income to the authorities or to finance illicit activities). Another important source of cash demand not captured by the CPS comes from overseas.
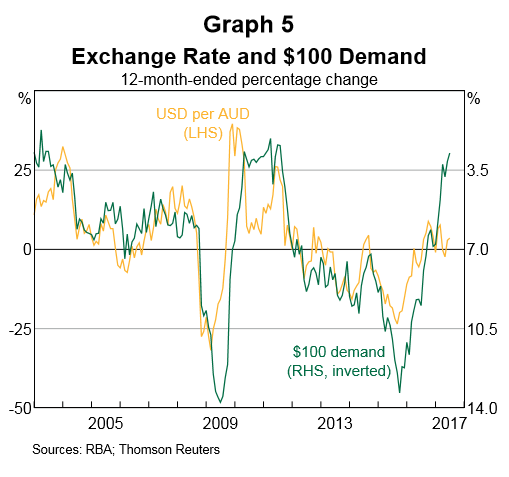
… a 10 per cent depreciation in the value of the Australian dollar (relative to the US dollar) is associated with a cumulative increase in $100 banknote demand of around 1 per cent over a three-month period…
The rising stock of banknotes in circulation alongside declining cash payments suggests that the velocity of cash has fallen over the past 10 years. That is, each banknote in circulation is being used in fewer transactions now than in the past…
In addition to its function as a means of payment, cash can also be held as a store of value. An increase in the value of banknotes held for store-of-value purposes necessarily reduces the velocity of cash because it has no effect on the value of cash payments…
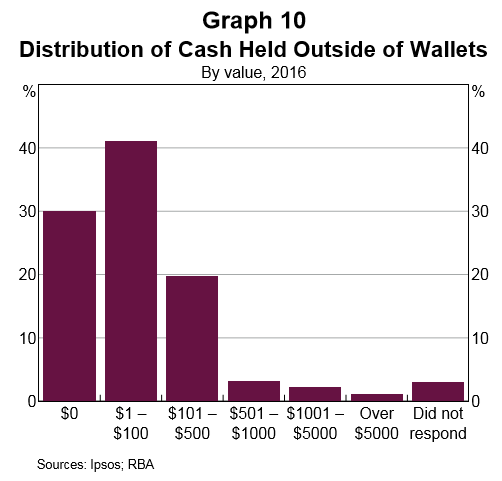
Around 70 per cent of participants in the 2016 CPS reported holding some cash outside of their wallet…
While most tend to hold less than $100, around 3 per cent of respondents reported holding amounts greater than $1 000, and 1 per cent hold more than $5 000 (the highest category)…
These results suggest that a large amount of wealth held in banknotes is concentrated in a relatively small number of households, which is broadly consistent with the distribution of wealth more generally. In fact, households with far greater stores of cash have been identified from damaged banknote claims received by the Reserve Bank over the past five years. A number of claims where ‘house fire’ was cited as the cause of damage were in excess of $20 000. While the total value of banknotes being held as a domestic store of value is difficult to extrapolate from these data, it is clearly an important source of domestic cash demand. The data from these claims also provide some evidence that high-denomination banknotes are preferred for store-of-value holdings.
…low global and domestic interest rates have reduced the opportunity cost of holding cash over other assets…
There is evidence to suggest that the expectation of a depreciation of the Chinese yuan is associated with an increase in demand for the Australian $100 banknote…
Okay, to sum up: Australians are using cash less often, therefore, cash changes hands less frequently and we need more in circulation. Or put another way, because banknotes are involved in fewer transactions, we need more banknotes to do the same amount of cash transactions.
That said, there does still seem to be a lot of cash used for potentially dodgy purposes (e.g. drug deals or tax evasion purposes). While the RBA doesn’t have any direct data, its damaged banknote facility has uncovered multiple examples of huge cash piles in excess of $20,000.
Leith van Onselen is Chief Economist at the MB Fund and MB Super. He is also a co-founder of MacroBusiness.
Leith has previously worked at the Australian Treasury, Victorian Treasury and Goldman Sachs.