
The Australian’s David Uren has penned an article today supposedly exposing “Labor’s inequality lie”. Uren sites unpublished data from the Household Income and Labour Dynamics of Australia (HILDA) survey, which shows that the percentage of people who are not able to pay their rent or mortgage on time has fallen from 6.5% in 2011 to 5.1%, while the percentage of people who are unable to heat their home has declined from 4.0% to 2.8%:
The number of people experiencing financial stress has fallen sharply in the past five years, contradicting Labor’s narrative of rising inequality.
Unpublished data from the Household Income and Labour Dynamics of Australia survey, which follows the lives of 17,000 people each year, shows the number who have had to ask for financial help from family or friends has dropped from 12.6 per cent in 2011 to 10.8 per cent. The share of the population unable to pay a bill on time has similarly fallen from 12.8 per cent to 11.1 per cent…
The share of people unable to heat their home has fallen from 4 per cent to 2.8 per cent, while the number unable to pay their rent or their mortgage on time has dropped from 6.5 per cent to 5.1 per cent…
Uren’s article follows a Fact Check published in The ABC on Wednesday, which found that inequality in Australia has unambiguously worsened since 1981 (Labor’s claim), even though the evidence is ambiguous over recent years:
Mr Morrison’s claim is unjustified.
The evidence Mr Morrison puts forward to support his claim focuses on a relatively short time frame and is subject to volatility.
Furthermore, his claim is underpinned by income data from the 2016 census that is potentially problematic, and unpublished calculations that have not been released for independent scrutiny.
Experts contacted by Fact Check broadly agree: Australia is less equal today than it was in, say, 1981.
And the broad trend over the decades since the early 1980s would appear to point to widening disparity.
However, the experts are not united about what has happened in recent years.
Some suggest inequality has got no worse, while others suggest it has.
This uncertainty is also reflected in the data: one credible set of figures shows a slight deterioration of inequality, another one a slight improvement.
The other problem with Uren’s position is that he has completely ignored inequality of wealth, which has unambiguously gotten worse.
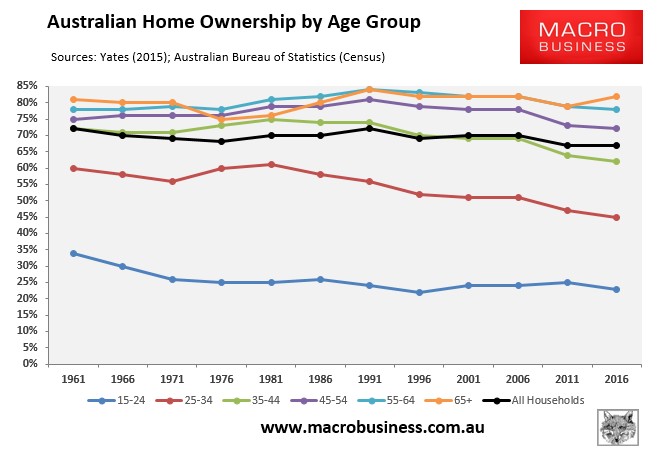
We know from the latest Census that home ownership among younger cohorts has collapsed, whereas it has remained steady or increased among older cohorts:
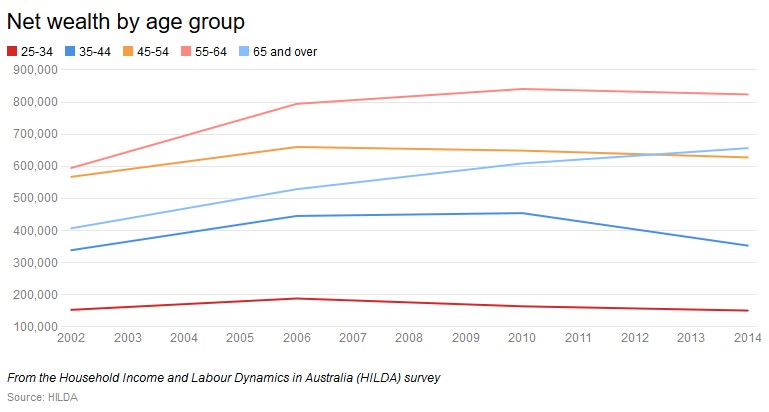
And this was backed-up by the HILDA survey:
For example, the rate of home ownership among 18 to 39 year olds declined from 36% in 2002 to 25% in 2014. And within this same age group, the decline in home ownership has been largest for families with dependent children, falling from 56% to 39%.
Moreover, even for those in this group who have managed to buy a home, mortgage debt has risen dramatically. In 2002, 89% of home owners in this age range had mortgage debt, whereas by 2014 this had risen to 94%.
The HILDA survey also showed that differences in average wealth by age have grown dramatically. For example, in 2002 the median net wealth of those aged 65 and over was 2.8 times that of people aged 25 to 34, whereas in 2014 this ratio had increased to 4.5:
Put simply, any examination of inequality must consider wealth as well as income.
