
No cigar for CPI:
JUNE KEY FIGURES
|
Mar Qtr 2017 to Jun Qtr 2017 |
Jun Qtr 2016 to Jun Qtr 2017 | ||
| Weighted average of eight capital cities |
% change |
% change | |
|
| |||
| All groups CPI |
0.2 |
1.9 | |
| Food and non-alcoholic beverages |
-0.2 |
1.9 | |
| Alcohol and tobacco |
0.8 |
5.9 | |
| Clothing and footwear |
-0.3 |
-1.9 | |
| Housing |
0.3 |
2.4 | |
| Furnishings, household equipment and services |
0.7 |
0.0 | |
| Health |
2.7 |
3.8 | |
| Transport |
-0.6 |
2.1 | |
| Communication |
-0.5 |
-3.8 | |
| Recreation and culture |
-0.6 |
-0.1 | |
| Education |
0.0 |
3.3 | |
| Insurance and financial services |
-0.1 |
2.1 | |
| CPI analytical series | |||
| All groups CPI, seasonally adjusted |
0.4 |
1.9 | |
| Trimmed mean |
0.5 |
1.8 | |
| Weighted median |
0.5 |
1.8 | |
|
| |||
And this was with weather disruptions. Rate hikes my butt. AUD down:
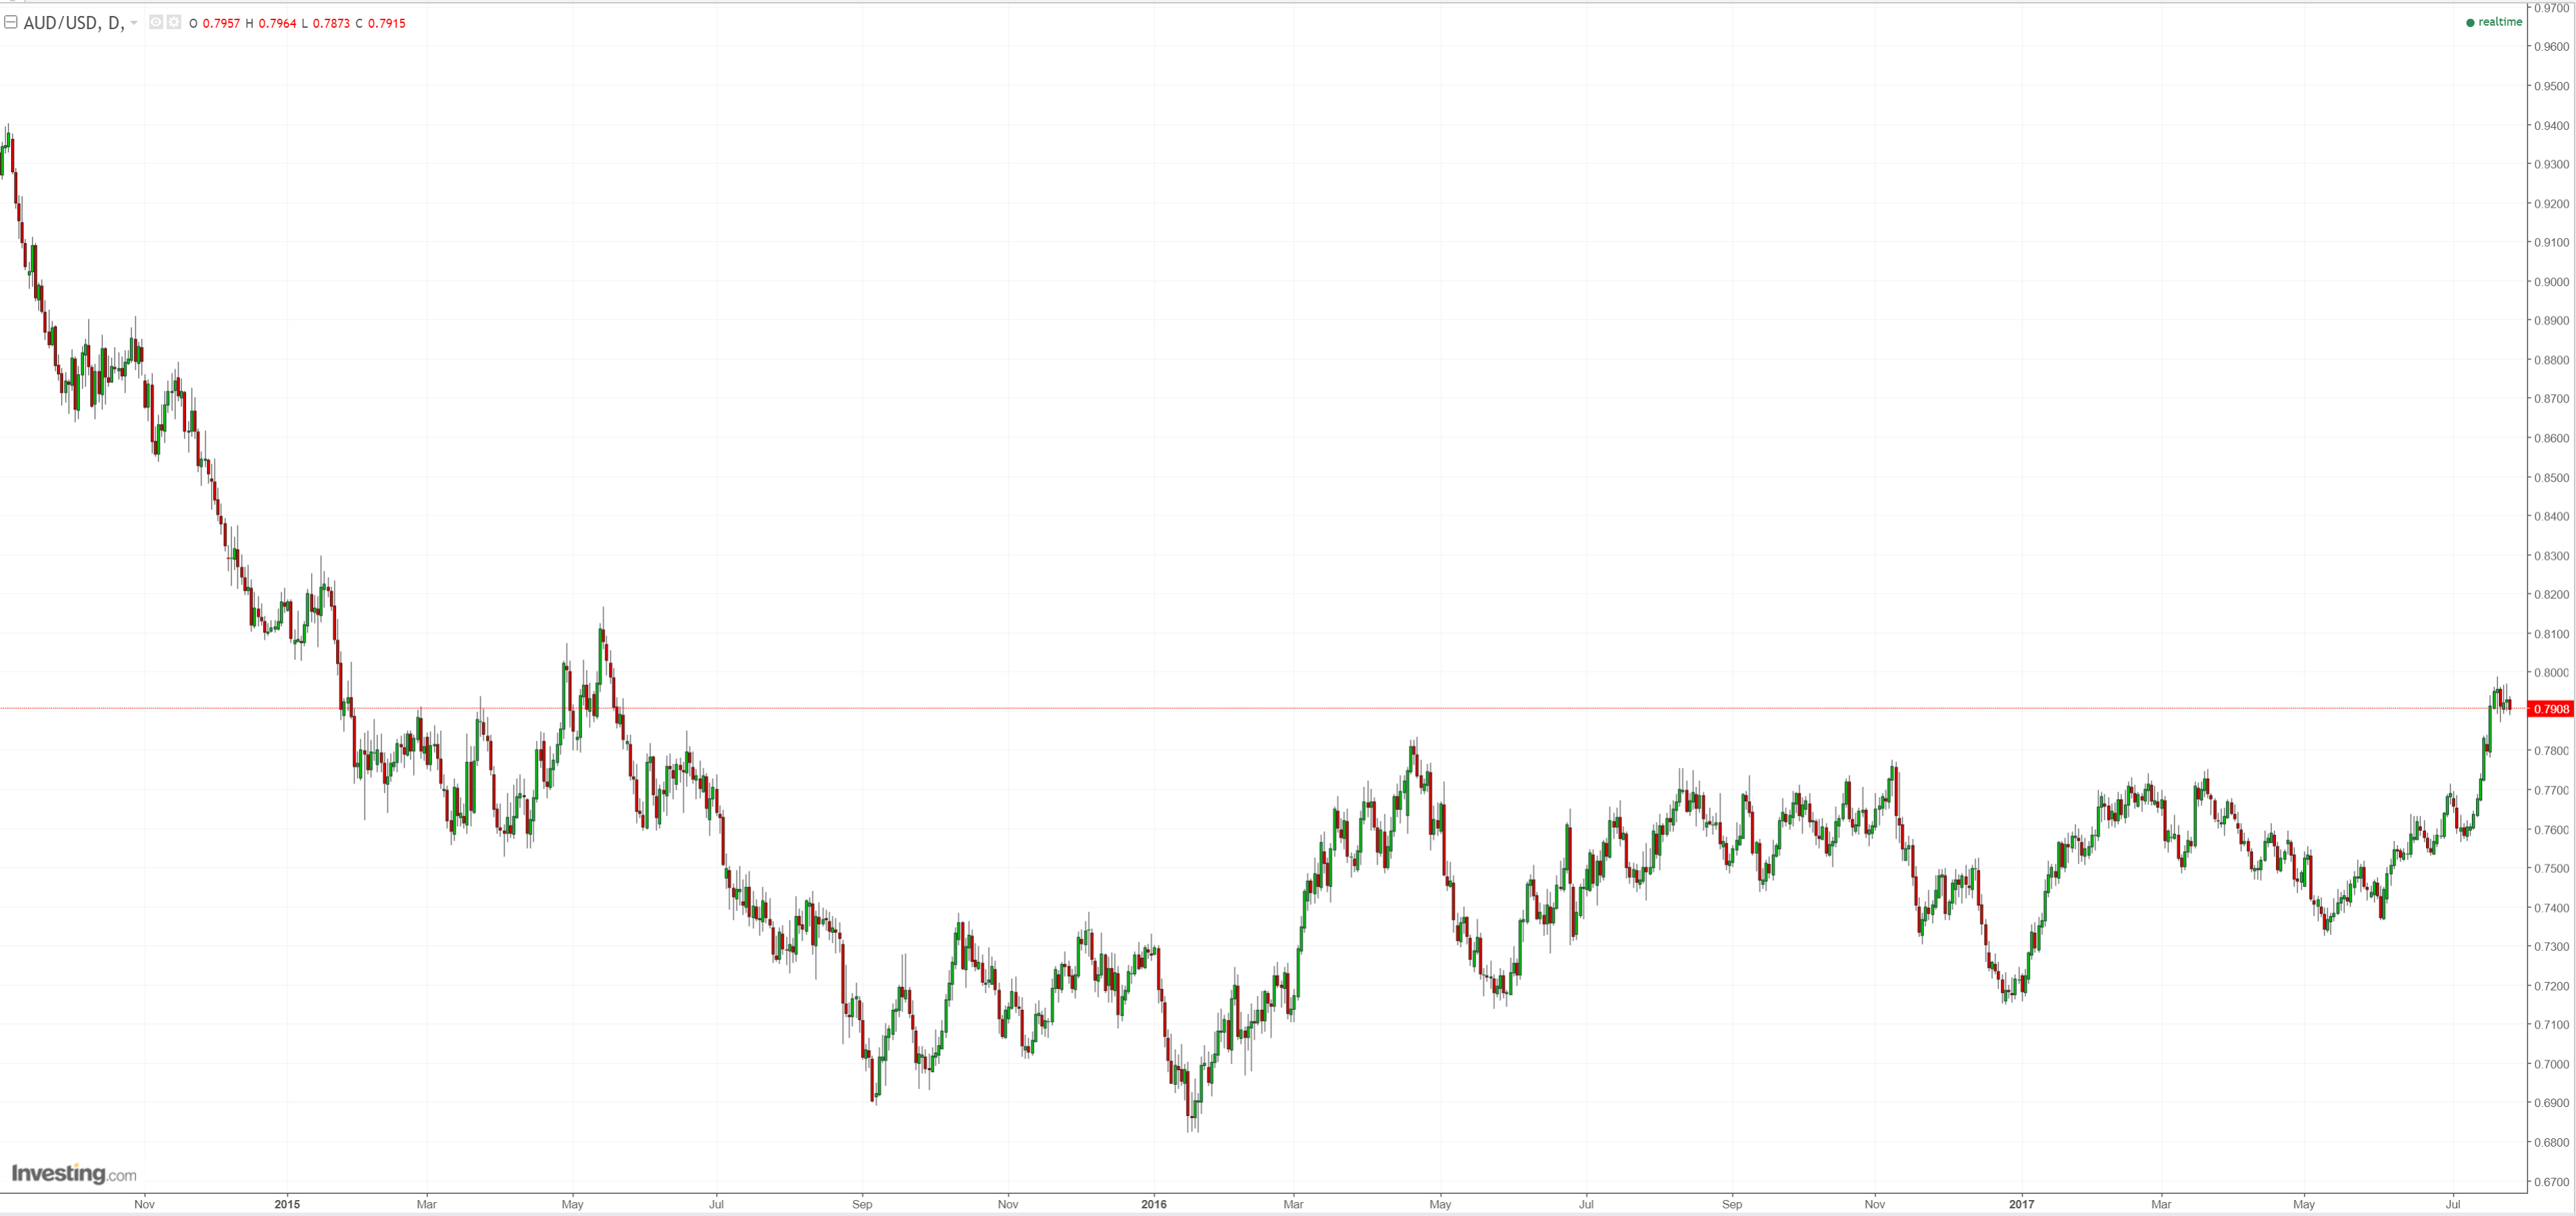
Much more to come.
Advertisement
