CoreLogic’s Cameron Kusher has penned a blog post showing how housing affordability worsened over the March quarter:
With dwelling values rising at a faster pace than household incomes, housing affordability has worsened over the first quarter of 2017…
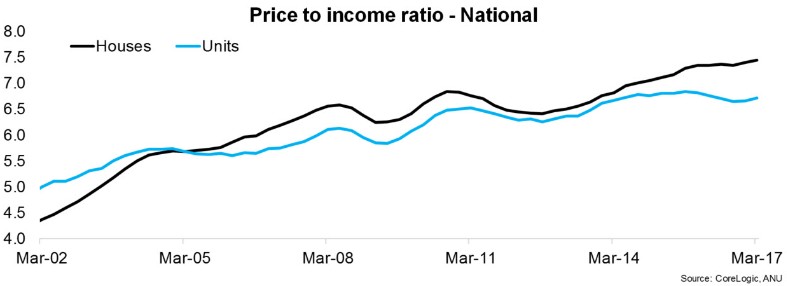
As at March 2017, the national price to income ratio was recorded at 7.3 compared to 7.2 a year earlier, 6.4 five years earlier and 6.1 a decade ago. Looking at houses and units, the ratios were recorded at 7.4 and 6.7 respectively at March 2017.
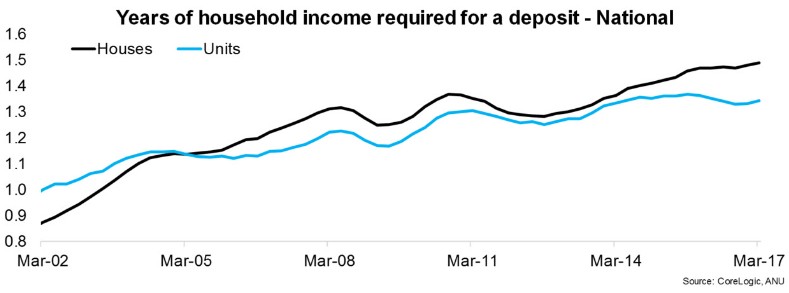
It would have taken 1.5 years of gross annual household income for a deposit nationally at the end of the March 2017 quarter. This is compared to 1.4 years a year earlier, 1.3 years five years ago and 1.2 years a decade ago. If saving for a house it would take 1.5 years of the median household income for a deposit compared to 1.3 years of income for a unit.
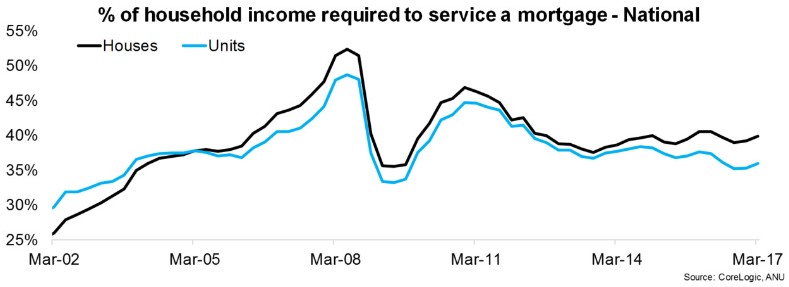
The calculation of the proportion of household income required to service a mortgage is very sensitive to mortgage rates. At the end of March 2017, the discounted variable mortgage rate for owner occupiers was 4.55% and a mortgage required 38.9% of a household’s income. A year earlier mortgage rates were 4.85% and the mortgage used 39.6% of the household income. Five years ago, mortgage rates were 6.7% and a decade ago they were 7.45% and households required 42.2% and 42.8% of their household income respectively to service a mortgage. Further to this you can see that the proportion of household income required to service a mortgage peaked at 51.0% in June 2008 when mortgage rates were 8.85%. Houses currently require 39.39% of a household’s income to service a mortgage compared to units requiring 36.0%…
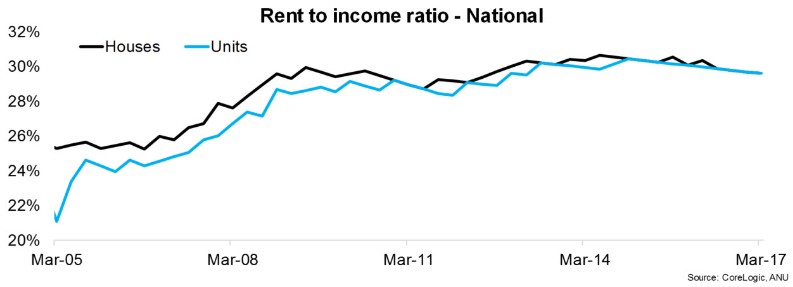
The rent to income ratio has been more stable compared with measures related to purchasing a home or servicing a mortgage, as it is more limited by growth in household incomes. In March 2017, the ratio was recorded at 29.6% compared to 30.4% a year earlier, 29.1% five years earlier and 25.8% a decade ago. At the end of March 2017 the ratio was recorded at 29.6% for houses and units…
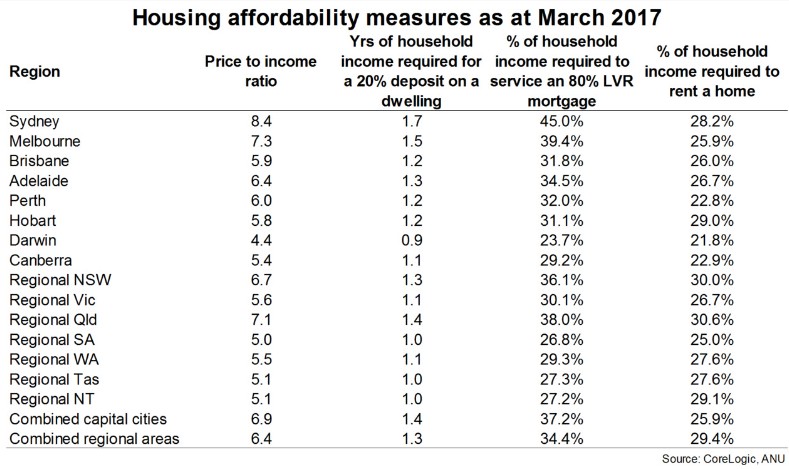
Capital cities are generally more expensive across all measures than regional markets despite household incomes generally being higher in capital cities…
This data provides a snapshot of how housing affordability is tracking across the country, and it highlights how in Sydney and Melbourne in particular it is deteriorating as dwelling values have risen over recent years.
Leith van Onselen is Chief Economist at the MB Fund and MB Super. He is also a co-founder of MacroBusiness.
Leith has previously worked at the Australian Treasury, Victorian Treasury and Goldman Sachs.