MacroBusiness

  • Home
  • Invest with MB
  • Primers
  • Aust. Economy
    • Back
    • Aust. Economy
    • Australian Politics
    • Australian Property
    • Australian Shares
    • Australian Dollar
    • Australian interest rates
    • Australian banks
    • Australian budget
  • Global Macro
    • Back
    • Global Macro
    • Carbon Economy
    • China Economy
    • European Economy
    • New Zealand Economy
    • US Economy
    • Economics
    • Capitalism
    • Global Housing
  • Commodities
    • Back
    • Commodities
    • Iron ore price
    • Australian LNG
    • Gold

Start your free 14 Day Trial

  • Access Subscriber Only Content
  • Special Reports with Unique Insights
Subscribe
Already a member?
Log in here
  • Search
  • Login
  • Start Free Trial

left

MacroBusiness

right

right mobile

MacroBusiness
  • Search
  • Login
  • Start Free Trial
  • Home
  • Invest with MB
  • Primers
  • Aust. Economy
    • Australian Politics
    • Australian Property
    • Australian Shares
    • Australian Dollar
    • Australian interest rates
    • Australian banks
    • Australian budget
  • Global Macro
    • Carbon Economy
    • China Economy
    • European Economy
    • New Zealand Economy
    • US Economy
    • Economics
    • Capitalism
    • Global Housing
  • Commodities
    • Iron ore price
    • Australian LNG
    • Gold

Primary Section

Share on Facebook Share on Twitter Share on Reddit
+
-

Australia’s housing bubble obliterates all records

By Unconventional Economist in Australian Property

at 12:16 am on June 21, 2017 | 21 comments

By Leith van Onselen

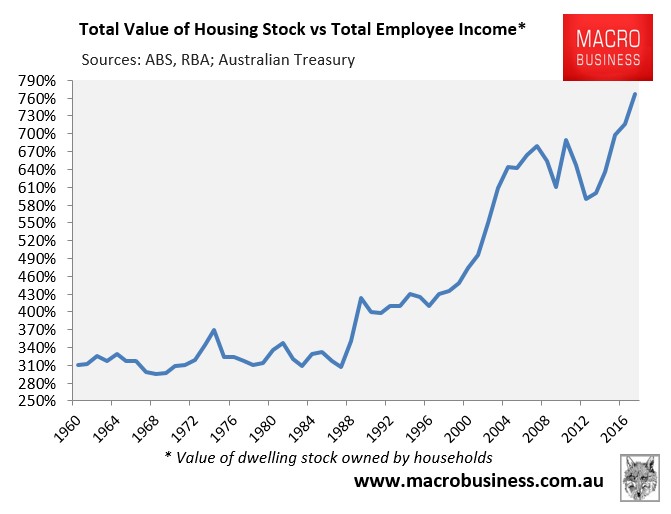
The ABS yesterday released its property price data for the March quarter, which valued Australia’s dwelling stock owned by households at a record $6.27 trillion dollars.

As shown below, the total value of Australia’s dwelling stock was an all-time high 7.7 times employee incomes as at March 2017, up massively from the previous peak of 6.90 times incomes in 2010:

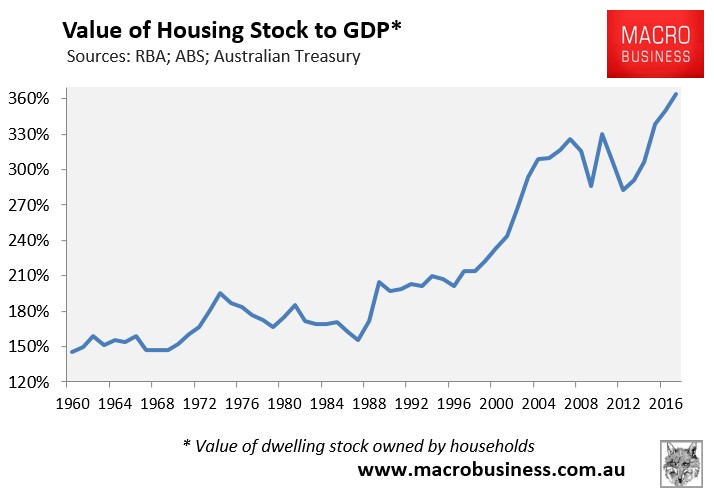
Similarly, the ratio of dwelling values against Australian GDP hit a record 3.64 times as at March 2017, up from the previous peak of 3.30 times GDP in 2010:

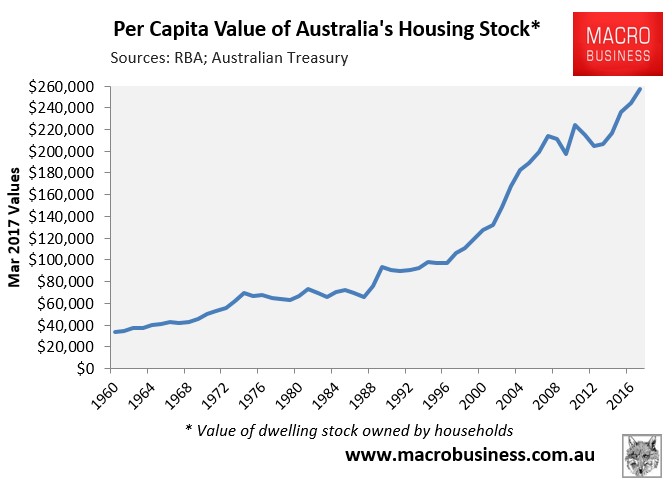
When divided by Australia’s population, Australian housing was worth a record $257,000 per man, women and child:

Australia’s house prices are also showing a record divergence from rents:

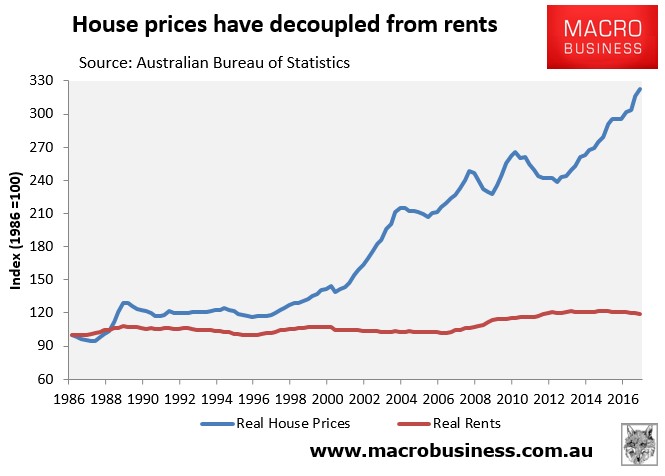
In fact, since Australian house values bottomed in September 2012, prices have risen by 36% in real terms versus no change (0% growth) in real rents.

Another way of measuring potential over-valuation in the housing market is to compare house prices against their earning capacity, as measured by gross rents, to determine the price-to-rent ratio. This is calculated as the inverse of the rental yields averaged-out across Australia’s three major data providers.

While the ABS doesn’t keep data on rental yields, CoreLogic, Domain and Residex do, and these are averaged-out below:

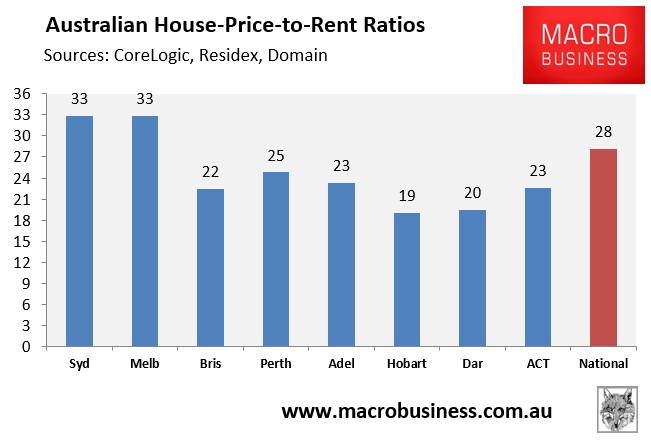
As you can see, Australia’s house price-to-rent ratio is an insane 28 times, driven by the bubble epicentres of Sydney and Melbourne (each 33-times rents).

Finally, the debt underpinning Australia’s housing values is also at the highest on record, the highest in the Anglosphere, and the second highest in the world (behind Switzerland):

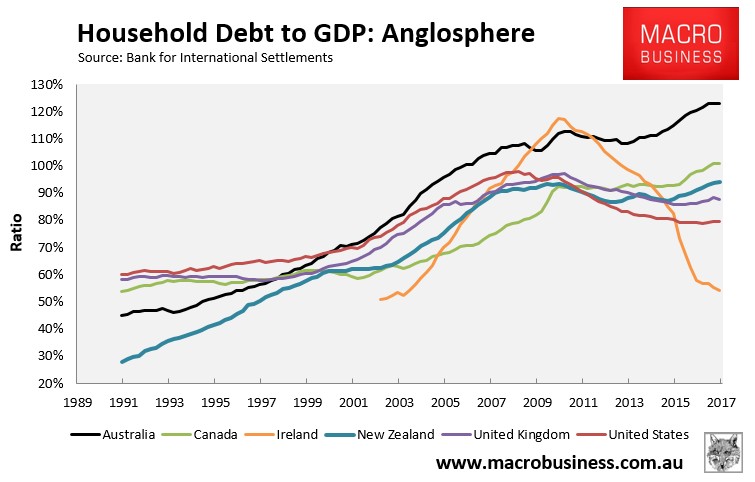
No matter which way you cut it, Australia has itself one helluva housing bubble!

[email protected]

Share on Facebook Share on Twitter Share on Reddit
+
-

YOU MAY ALSO BE INTERESTED IN

Does falling mortgage growth matter for house prices?

Does falling mortgage growth matter for house prices?

By Leith van Onselen Following yesterday's

CoreLogic: Listings surge causes heavy vendor discounting

CoreLogic: Listings surge causes heavy vendor discounting

By Leith van Onselen This week's Housing Pulse

Final auction clearance rate dives back into the 40s

Final auction clearance rate dives back into the 40s

By Leith van Onselen Last weekend, CoreLogic

Mortgage credit growth accelerates downwards

Mortgage credit growth accelerates downwards

By Leith van Onselen The Reserve Bank of

Comments are hidden for Paid Subscribers only.

Start your free 14 Day Trial

  • Access Subscriber Only Content
  • Special Reports with Unique Insights
Subscribe
Already a member?
Log in here
MB Fund

Put the power of MacroBusiness into your portfolio.
Click for more information

Recent Performance* Jan 2019 Since Inception (p.a.)
MB International +4.3% +10.3%
MB Tactical Growth +3.6% +7.7%
MB Tactical Foundation +2.3% +6.2%
*The above returns include trading costs and maximum administration fees – clients with higher balances will have better performance. Note individual client performance will vary based on the amount invested, ethical overlays and the date of purchase. Past performance is not an indication of future performance.
Special Reports
  • Asset allocation in the great Australian adjustment
  • Australia and the 100 year bust
  • How to profit from a house price crash
  • Is the commodities crash finally over?
  • MacroBusiness Seminar Series
  • Master yourself, then markets
  • Tackle risk for super returns
  • The economy in February
  • The great housing "shrinkflation"
  • The negative gearing bible
Recent Posts
  • Julie Bishop deals death blow to Scummo | 77 comments
  • Australian dollar hammered as China bans Aussie coal | 67 comments
  • Bill Evans breaks: RBA to cut, cut, cut! | 21 comments
  • Westpac hit with class action over ‘irresponsible’ mortgages | 48 comments
  • McGrathmageddon: “Exceptional” property market “resurgent” | 38 comments
  • Corruption swamps Scummo Government | 82 comments
Meet the bloggers
  • Cameron Murray
  • Chris Becker
  • Damien Klassen
  • David Llewellyn-Smith
  • Deep T.
  • Delusional Economics
Follow us on social media
Back to Top
  • About
  • Contact
  • Subscribe Free
  • Comment rules
  • Disclaimer
MacroBusiness
Copyright © 2019 Macro Associates ABN: 17 149 497 530.
Website Design &
Development by Emmix