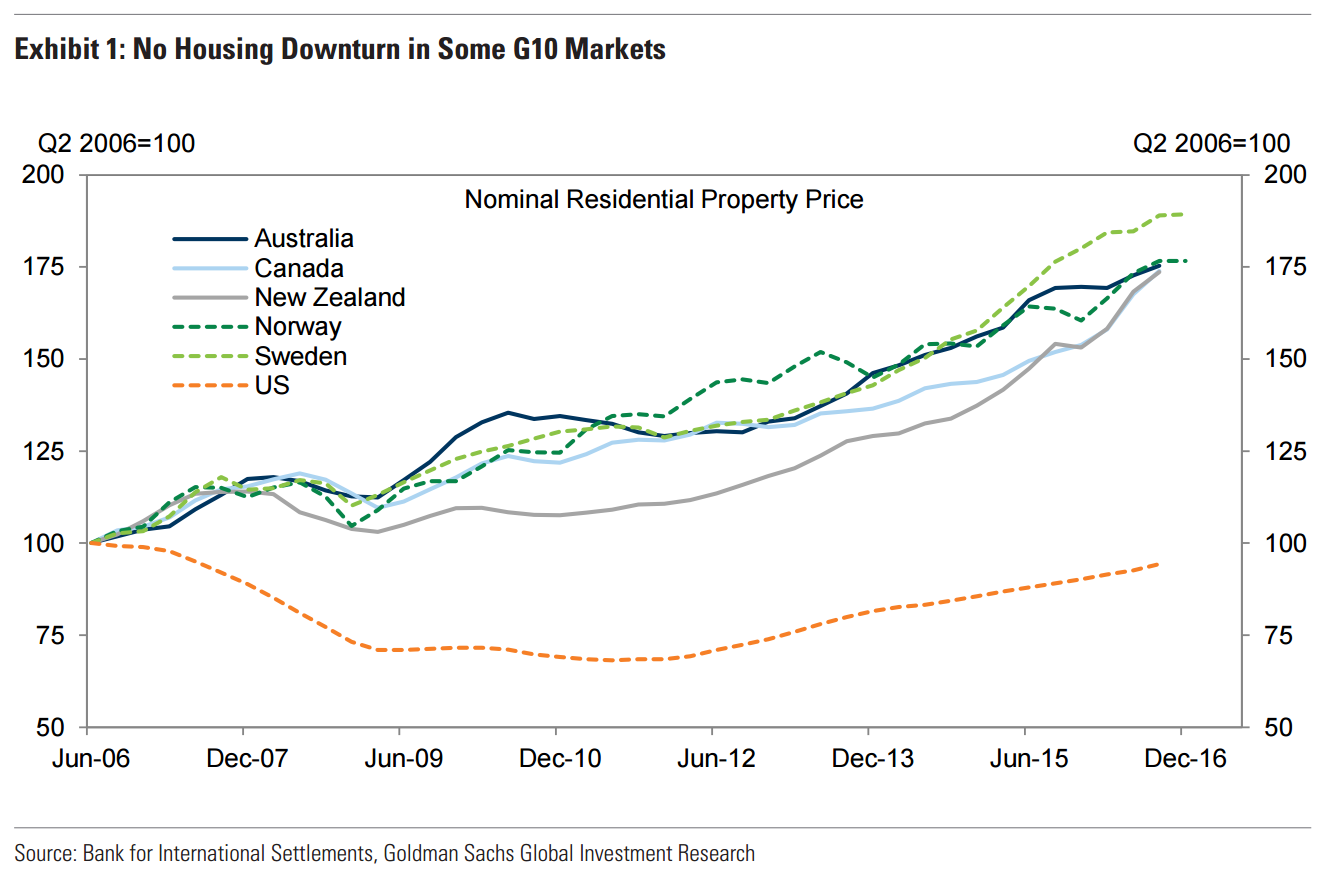
The boom, bust, and recovery in US house prices dominated much of the macro debate in markets over the last 15 years. This cycle is now essentially complete: according to the S&P/Case-Shiller index1. , US house prices peaked in July 2006, troughed in February 2012, and returned to their pre-recession level in November 2016. In contrast, real estate markets in some other G10 economies saw no such downturn despite the global recession: prices, building activity, and mortgage credit continued to rise unabated (Exhibit 1). In some cases, the run-up has gone far enough that it has raised concerns about the broader consequences for economic and financial stability if real estate markets were to sour. While prices are indeed elevated in several markets, there are also important differences across countries, and some important idiosyncratic factors to take into account. We do not see imminent problems in G10 real estate markets, but current imbalances could exacerbate cyclical weakness down the road.
Building Imbalances
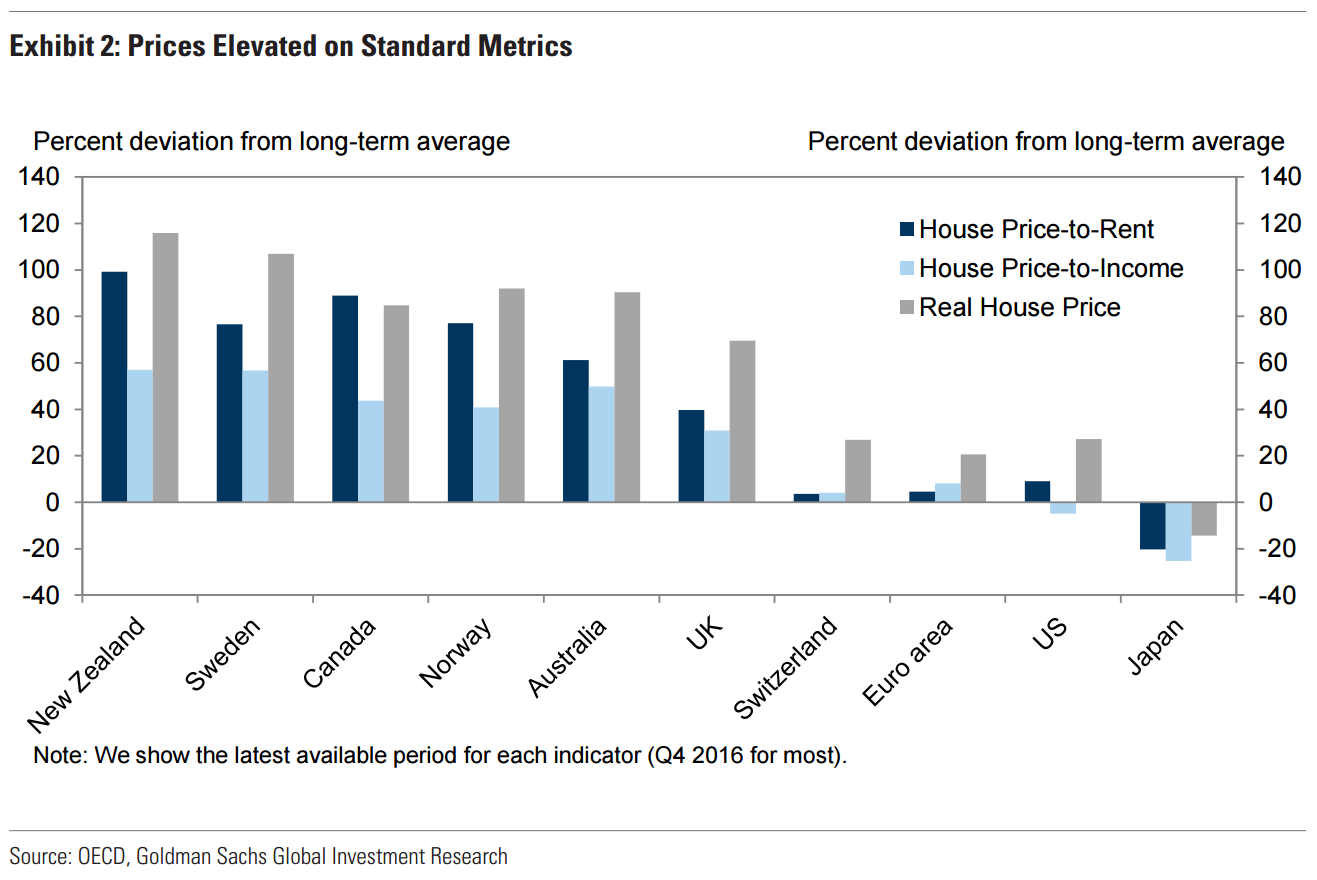
Elevated prices offer the simplest evidence of emerging imbalances in G10 real estate markets. In Exhibit 2, we compare house price levels across economies using three standard metrics: (1) the ratio of house prices to rent, (2) the ratio of house prices to household income, and (3) real house prices (i.e., house prices deflated by a consumer price index). Using an average of these measures, house prices in New Zealand appear the most overvalued, followed by Canada, Sweden, Australia, and Norway; house prices also appear somewhat overvalued in the United Kingdom, but less so than in the first group. In the remaining G10 markets, current prices appear close to fair or slightly cheap. To put these numbers into context, at the peak of US house prices in 2006, the price-to-income ratio and price-to-rent ratios were about 15% and 30% above their long-run averages, respectively. Therefore, house prices indeed look quite high for several of the small open G10 markets.
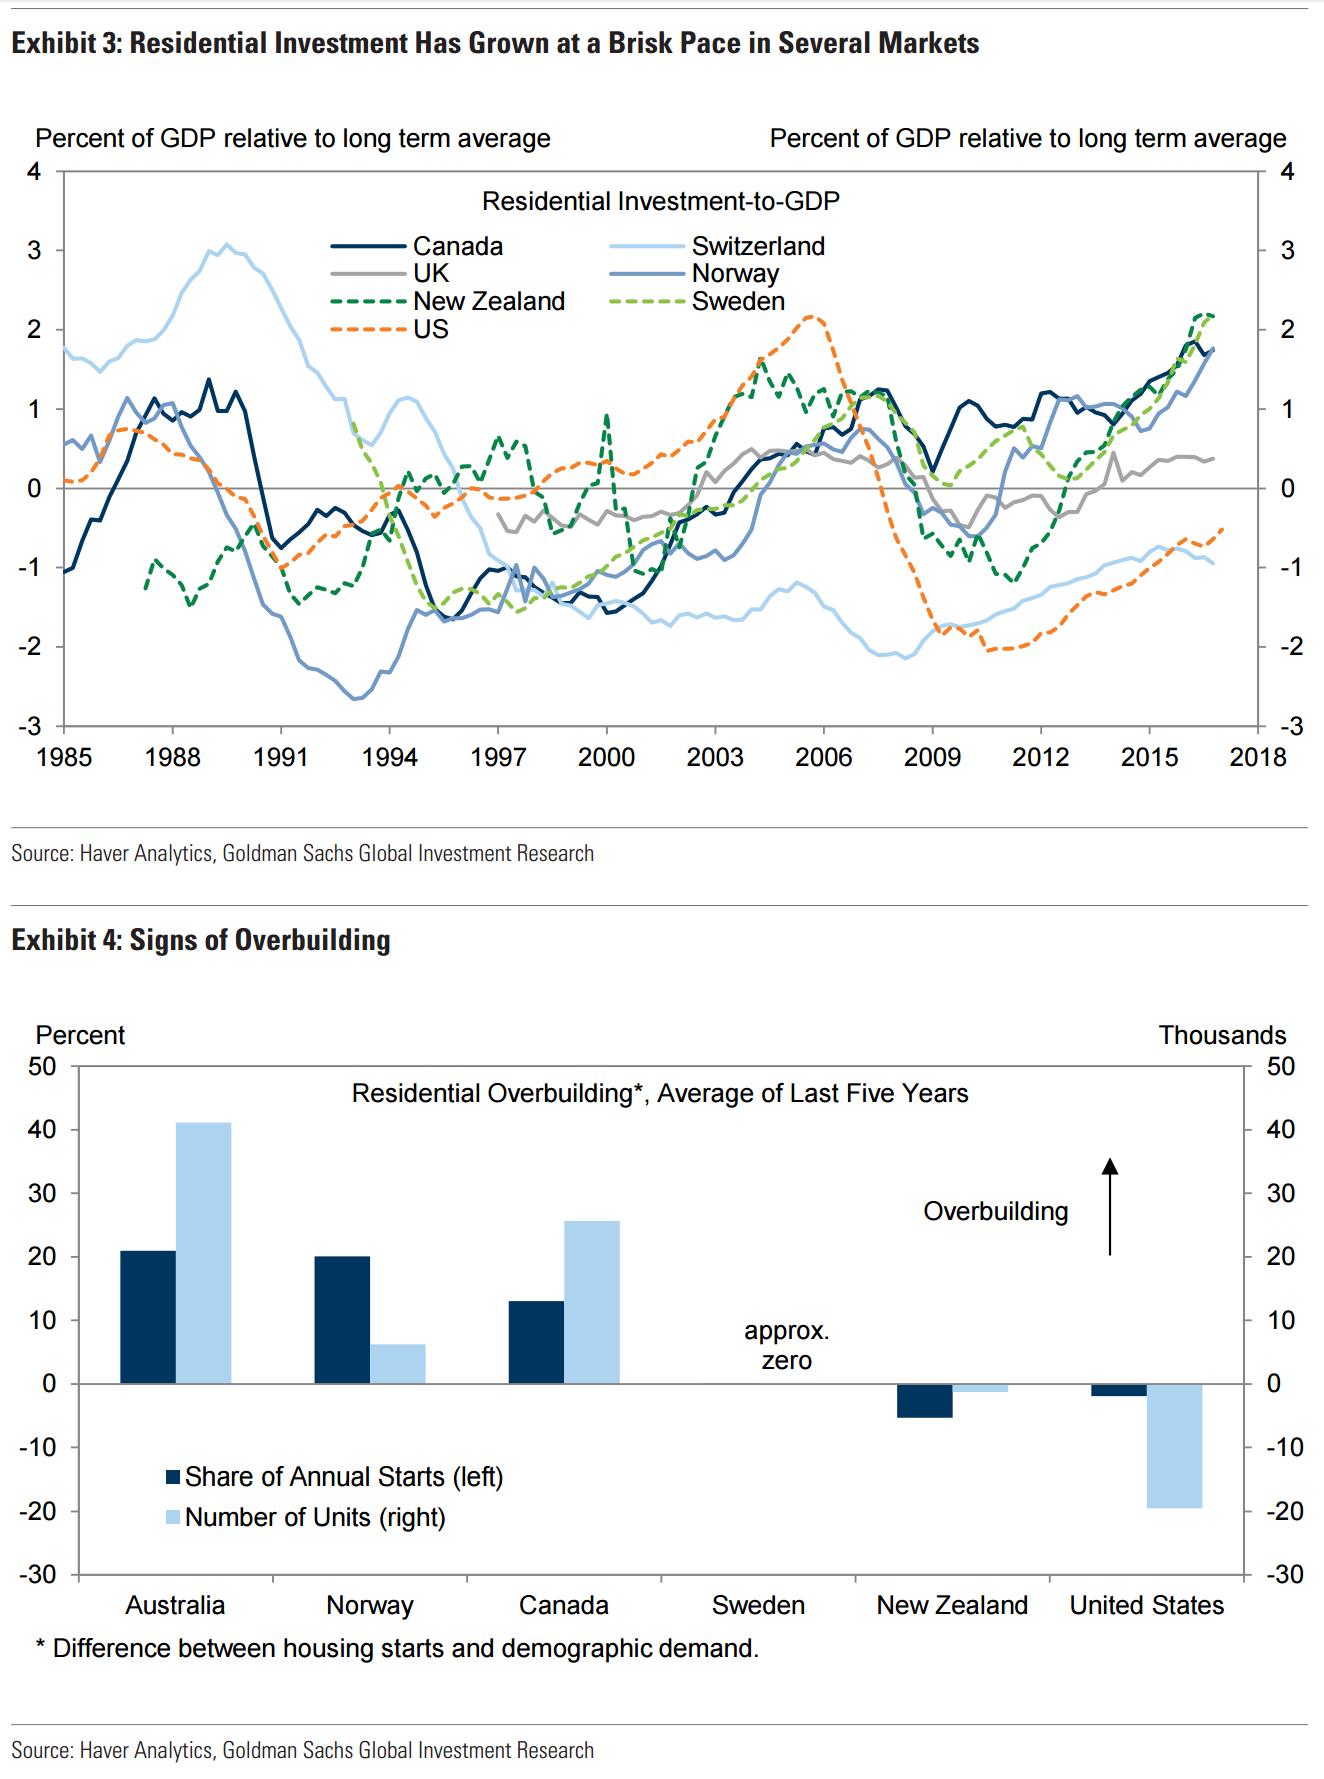
Combined with high and rising house prices, residential investment has grown at a brisk pace in several of these markets. For example, residential investment as a share of nominal GDP exceeds long-run averages in Sweden, New Zealand, Norway, Canada, and the UK. 3. In all of these markets except the UK, the difference between current residential investment and long-run averages resembles the peak in the US before the 2008-09 recession (Exhibit 3).
An alternative measure of overbuilding shows somewhat more dispersion across countries. In our analysis of US real estate markets, we often compare housing starts (or completions) to underlying demographic demand for housing—i.e., the amount required to shelter the growing population, given a certain number of persons per household. We apply that same analysis here for the G10 countries with sufficient data availability. Specifically, we calculate the underlying demographic trend in household formation by dividing the change in the resident population by the average number of persons per household. We then compare the five-year average of this estimate with the five-year average of housing starts. In this way we can test whether building activity is high due to faster population growth or whether it reflects an increase in the housing stock relative to the population.
Whereas our group of countries showed a similar increase in the share of residential investment in GDP, this measure suggests the degree of overbuilding differs across markets (Exhibit 4). In particular, for both Sweden and New Zealand, the degree of overbuilding does not appear elevated. In both cases the likely reason has been a surge in immigration, and the resulting increase in population growth compared to earlier years. As a result, an increase in the share of residential investment in GDP is likely warranted. In contrast, Australia, Norway, and Canada appear overbuilt on both measures: new homebuilding activity has outstripped the demographic demand for housing. We would stress that in the case of Canada—a focus for many investors at the moment—there are important regional disparities to keep in mind: we do see an excess of vacant housing, but primarily in Saskatchewan and Alberta, where declines in potash and oil prices, respectively, resulted in concentrated local housing shocks.
High Debt, Low Rates
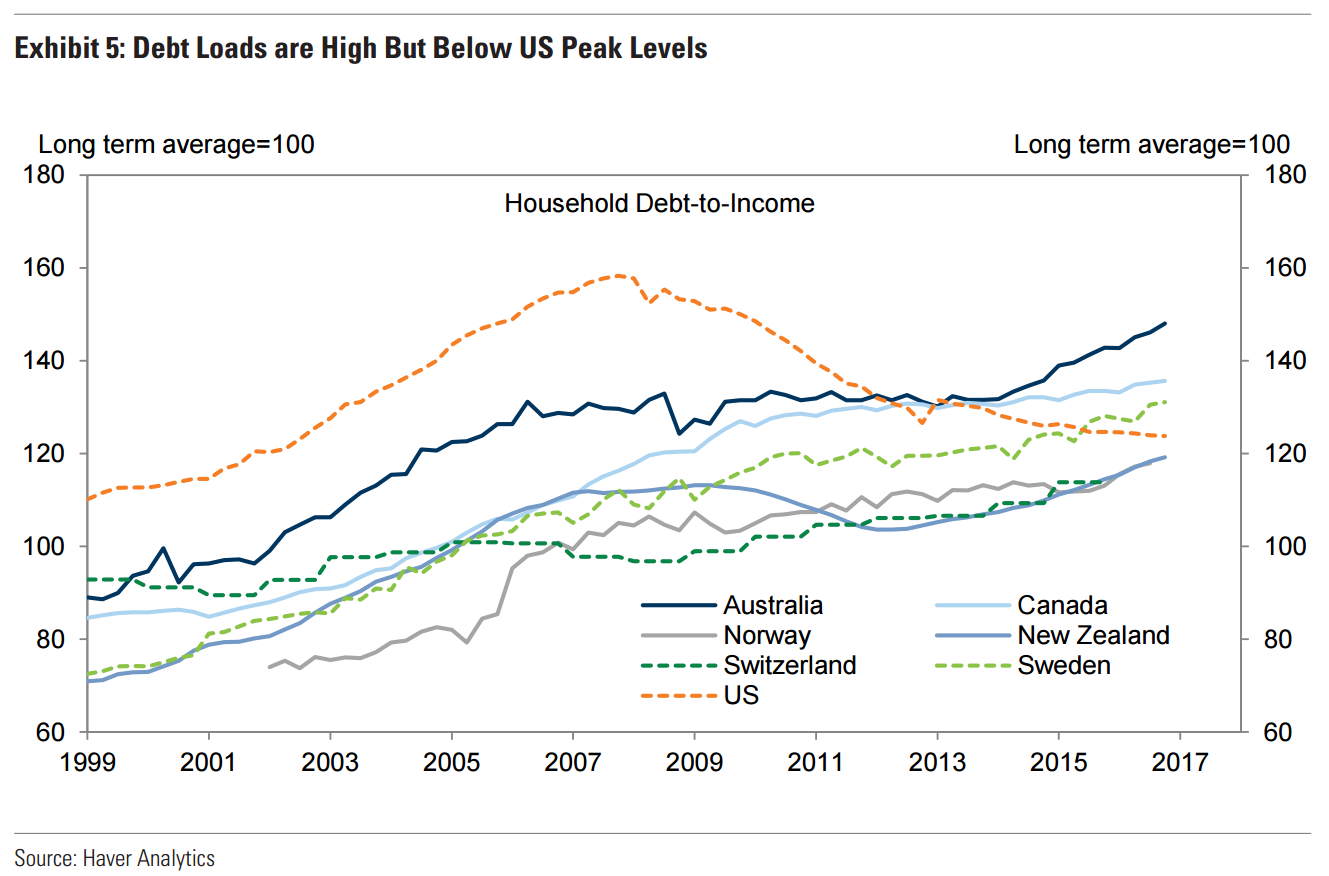
Alongside the rise in house prices and building activity, most of the G10 markets under consideration have also seen a buildup of consumer mortgage debt. Indeed, in all cases, household debt relative to disposable income stands at record levels. That being said, we think it is most appropriate to compare debt loads relative to each economy’s own history due to structural differences across markets (e.g., levels of GDP per capita; see here for background). By this standard, current debt loads are high, but still below the peak levels reached in the US before its housing downturn (Exhibit 5). Relative to historical norms, Australia stands out with a particularly high mortgage stock, followed by Canada and Sweden. For the other markets, debt levels, while above average, do not appear exceptionally high.
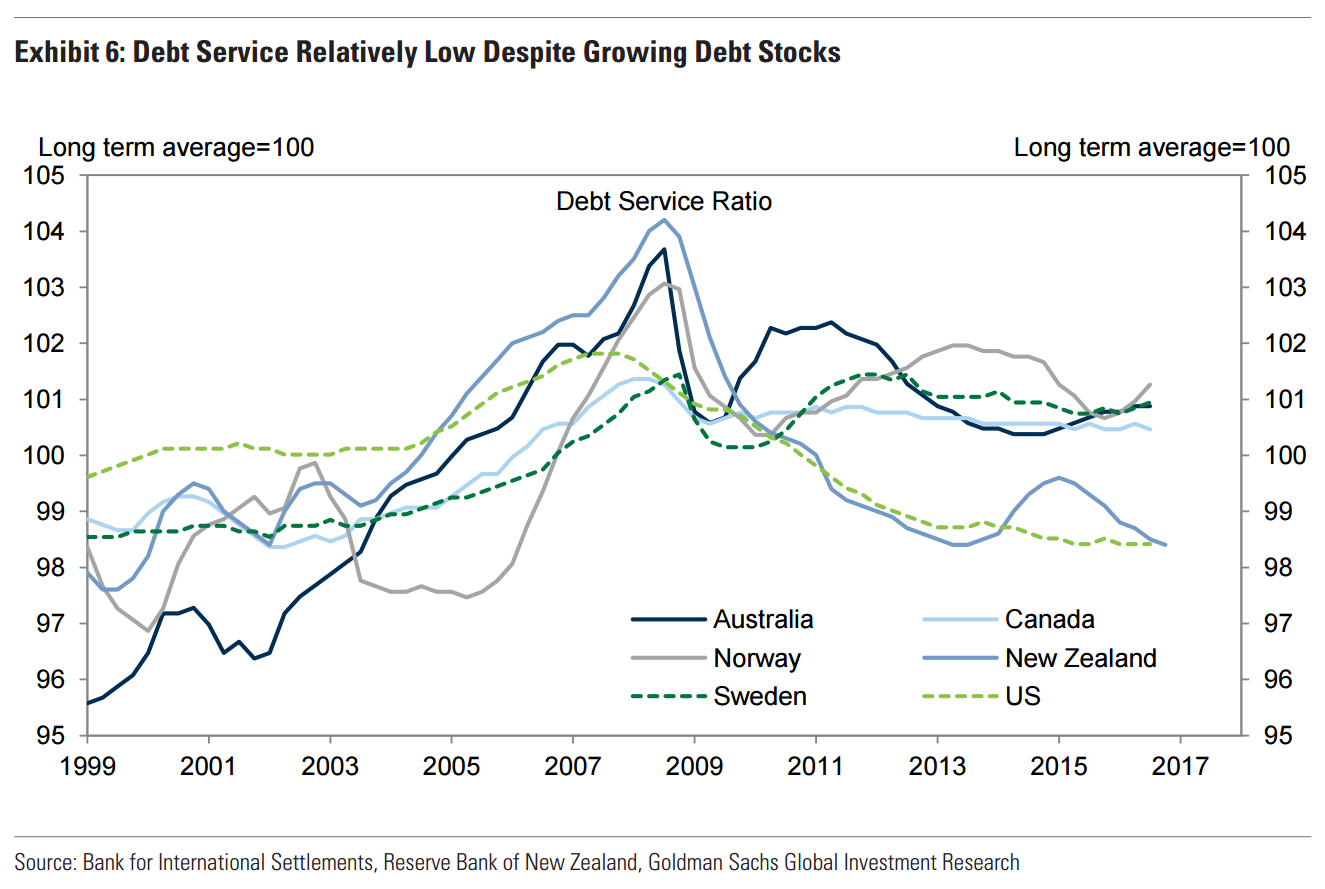
In all cases, debt service ratios (interest payments plus amortization as a share of income) have remained relatively low despite growing debt stocks—a result of historically low interest rates. Exhibit 6 plots debt service ratios for this group of countries. In most cases debt service ratios have held roughly constant in recent years. In New Zealand, which went through a modest consumer deleveraging cycle after the 2008-09 recession, debt service ratios are actually fairly low compared to historical norms. While a positive for the near term, high debt stocks but low debt service ratios imply that households may be more exposed to higher interest rates than in the past, especially markets with variable-rate mortgages.
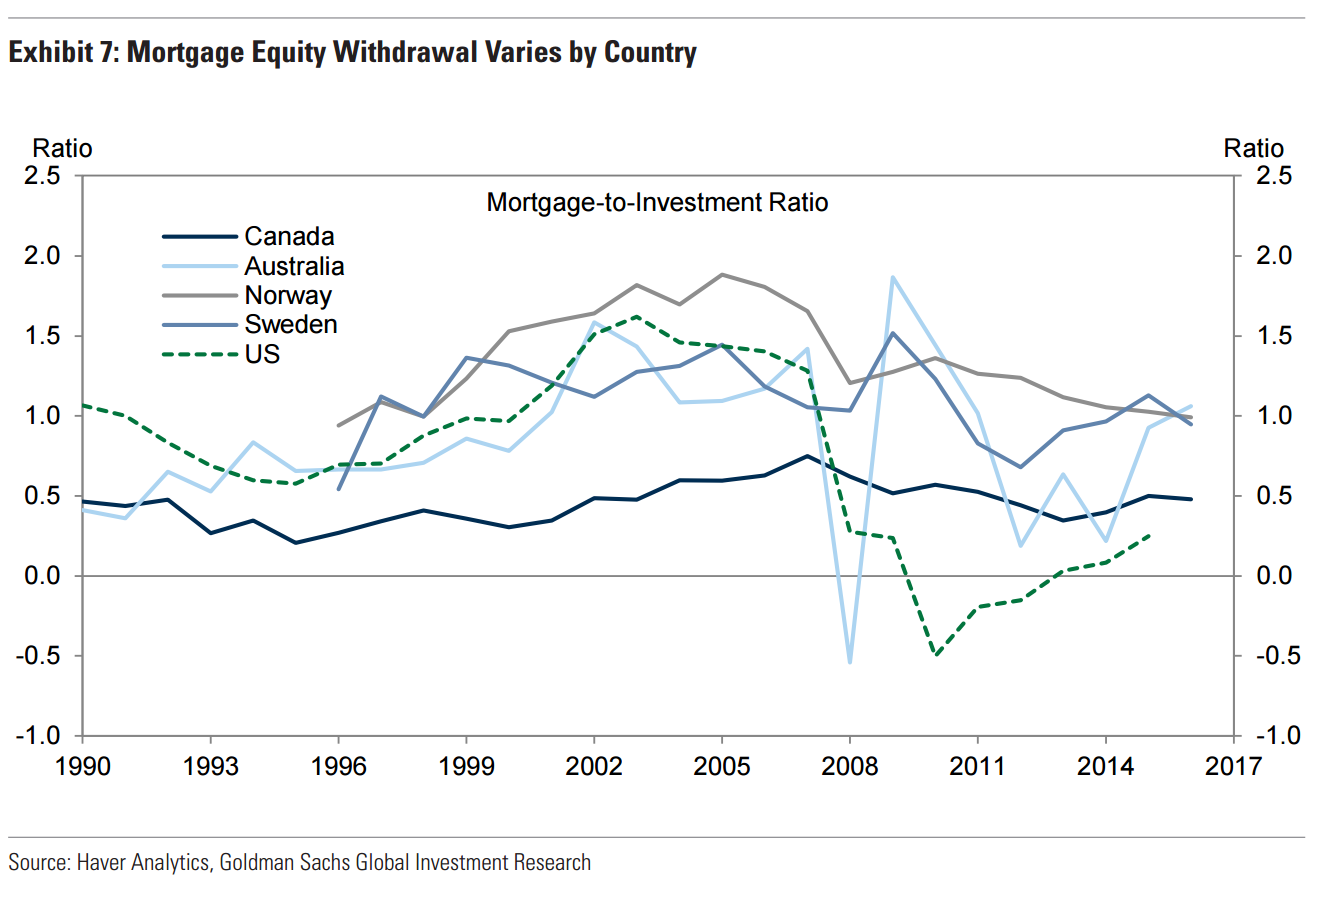
Lastly, the degree to which non-housing activity has benefited from mortgage finance differs across countries. Using National Accounts data we create a crude proxy of mortgage equity withdrawal (MEW) by dividing the change in mortgage debt by the flow of new housing investment. In 2003-06 this MEW proxy reached 1.5 in the US, before falling to negative levels after the recession. Currently these ratios are below the pre-recession US peak across the rest of the G10. On a relative basis, MEW levels (by our proxy) are higher in Australia, Norway, and Sweden, and lower in Canada (although we would note that we are not including other types of consumer credit; Exhibit 7).
Quantifying the Risk
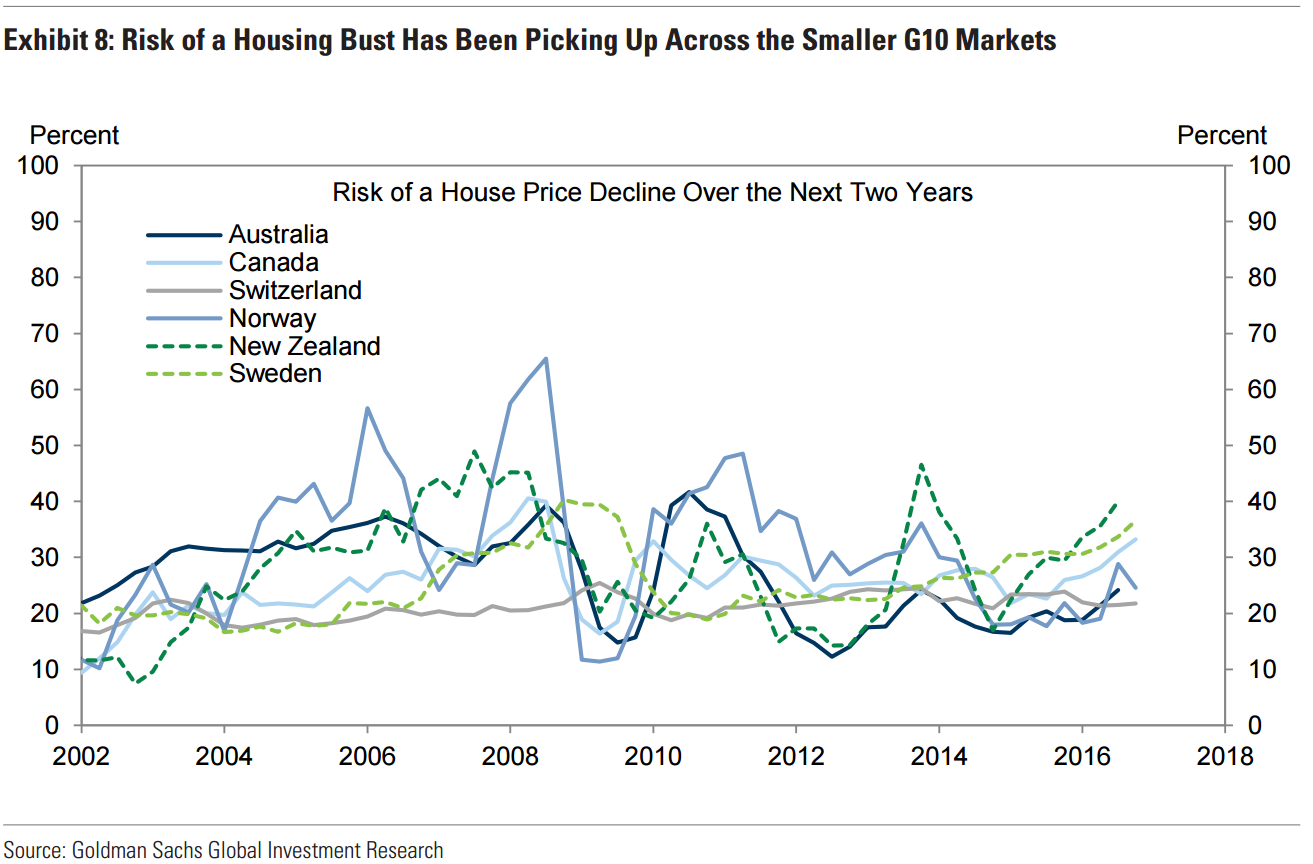
In an effort to combine the various predictors we re-estimate our model of asset price “busts” (see here) to quantify the probability of a housing downturn—defined as a decline in real house prices of 5% or more. Consistent with past work, we find that the pace of credit growth over the prior five years is an important indicator of asset price busts. Our housing bust model also includes the house price-to-rent ratio, past changes in real house prices, the investment-to-GDP ratio, real GDP growth, and inflation.
As shown in Exhibit 8, the probability of a house price bust has been picking up across the smaller G10 markets in recent years—a result of rising prices and high credit growth. According to the model, the probability of a housing bust over the next 5-8 quarters is the highest in Sweden and New Zealand at 35-40%. Canada follows closely behind with an implied probability of about 30%. For the remaining countries, the model-implied probability of a housing bust is around 20-25%.
We would stress that this model is just one tool, and it has a few key drawbacks. It particular, the model tends to predict housing busts too often—about half of all warning signals do not result in a meaningful downturn in real house prices. 5. Moreover, the model does not necessarily tell us what will happen to real activity as house prices decline. In the cases of Sweden and New Zealand, rapid homebuilding and house price inflation have been supported by immigration booms. As a result, building activity may hold up even if prices fall. Similarly, a full assessment of the spillovers to the financial system and broader economy would require more detailed analysis of mortgage performance and bank balance sheets.
A Range of Risks
Taking the model output and other data into account, we see reason for some concern about house price developments in the small open G10 economies. Prices do appear overvalued and credit growth has been high—traditional warning signs of real house price declines. However, there are a number of country-specific considerations which may affect the timing of a housing downturn and/or its effect on the broader economy. These include the immigration booms in Sweden and New Zealand, the regional disparities across the Canadian housing market, and differences in financial system stability and mortgage underwriting standards. In our view the case for a decline in house prices is probably the strongest in New Zealand and Sweden, but there looks to be more scope for spillovers to the broader economy in Australia (due to overbuilding, high debt stocks, and higher MEW); the Canadian market falls somewhere between these groups. In general we do not expect imminent problems in G10 real estate markets, but current imbalances could exacerbate cyclical weakness down the road.
David Llewellyn-Smith is Chief Strategist at the MB Fund and MB Super. David is the founding publisher and editor of MacroBusiness and was the founding publisher and global economy editor of The Diplomat, the Asia Pacific’s leading geo-politics and economics portal.
He is also a former gold trader and economic commentator at The Sydney Morning Herald, The Age, the ABC and Business Spectator. He is the co-author of The Great Crash of 2008 with Ross Garnaut and was the editor of the second Garnaut Climate Change Review.