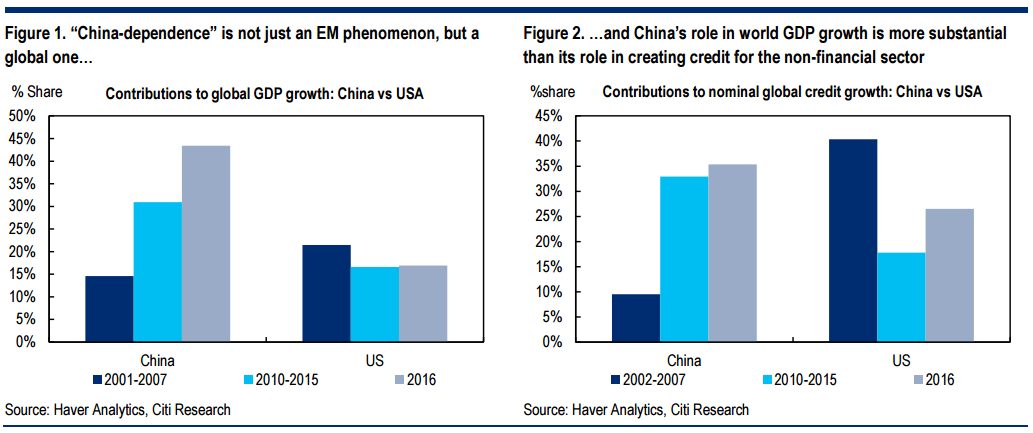
‘China-dependence’ is not an EM-specific phenomenon, of course. The rise in the world economy’s dependence on China is captured in Figure 1, which shows the relative contributions to global growth that come from China and the US. China contributed 43% of global GDP growth last year; the US, 17%. It has been almost 20 years since the US had the same relative contribution GDP growth that China has today: in 1998-99, in the wake of the Asian crisis, the US’ contribution to global GDP growth was 45%, but has never regained that level in the years since then. And given all the attention that investors devote to China’s credit markets, it is worth highlighting that China’s contribution to global GDP growth is actually more substantial than China’s contribution to global credit extension to the non-financial sector (according to BIS data, Figure 2). So it’s not just EM that has a Chinadependence problem, but the world.
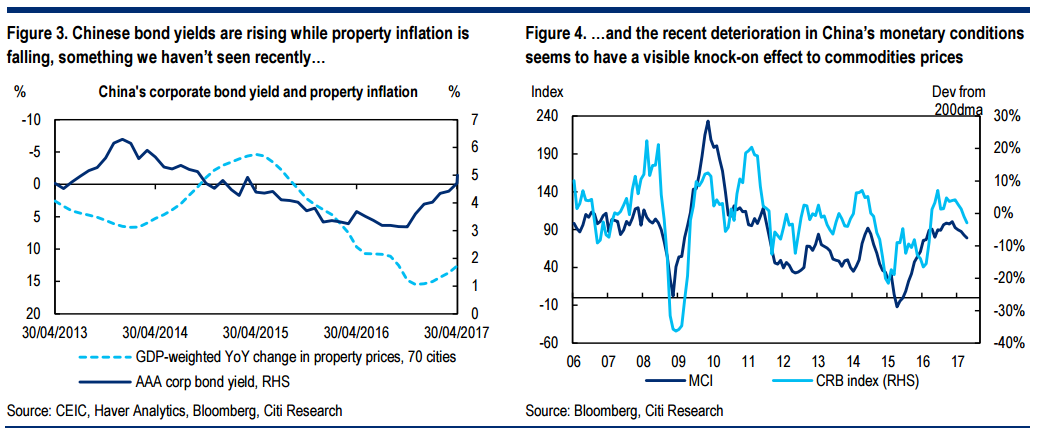
China-dependence is worth investigating now because of recent fears that Beijing’s ‘regulatory tightening’ creates unwelcome slowdown risks. ‘Regulatory tightening’ is associated with the China Banking Regulatory Commission, whose new Chairman Guo Shuqing has presided over the issuance of a number of documents that require Chinese commercial banks to tighten their risk management and end ‘inappropriate activities’, and have a specific emphasis on restricting interbank lending and bank lending to non-bank financial institutions. The decline in risk appetite that has followed the publication of these documents was reinforced by President Xi’s late-April speech to the Politburo in which he described financial stability as ‘strategically important’. This followed a message in March to the Communist Party’s financial work meeting in which he vowed to ‘unswervingly crack down on illegal activities’. Overall, market participants have the impression that there are risks to Chinese credit supply, particularly given the background of a tightening in PBOC-supplied liquidity during Q1 and previous efforts to prevent bubbles arising in the property market. And as Figure 3 shows, recent months have seen a simultaneous rise in bond yields and decline in property inflation for the first time in recent memory. The collapse in bond market activity has been a particular source of downward pressure on overall credit supply: bond issuance accounted for almost a quarter of total social financing last summer, that share has now fallen to 7%.
The last time ‘regulatory tightening’ was a theme was in early 2015, with unpleasant results. In early 2015 the problem wasn’t regulatory tightening of financing, but of fiscal policy. Chinese local governments faced hard budget constraints for the first time from the start of that year, while the publication of ‘Document 43’ restricted their ability to issue bonds until their debt levels had been ratified by central government. That regulatory initiative was to some extent behind the sharp slowdown that China suffered during the next few months, since it induced a contraction in local government spending. It took a large late-2015 credit stimulus to bring that slowdown to an end. As things stand, we remain cautious but not overly concerned about Chinese growth1 , not least because of recent evidence that the authorities wish to support domestic liquidity conditions in order to avoid a sharp slowdown. In any case, though, it is worth asking the question: if Chinese data gets notably worse, who in EM suffers the most?
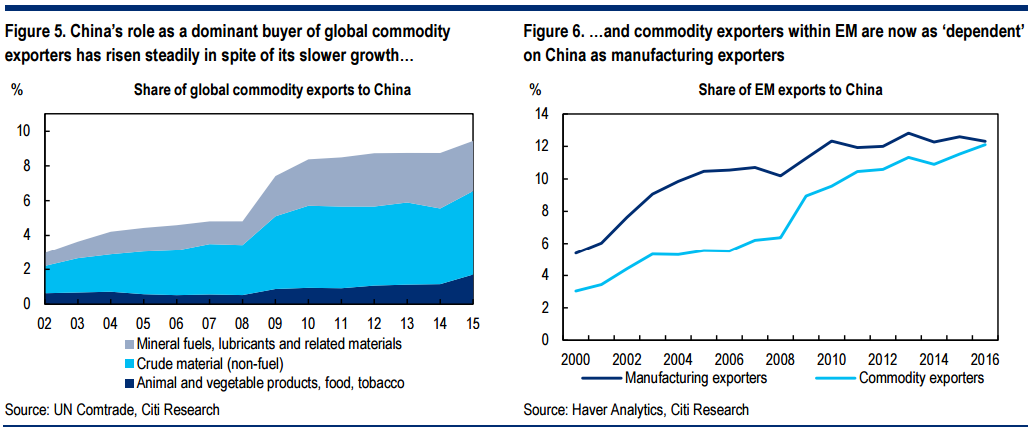
The fastest-growing linkage between China and EM is through the commodities market. This point is neatly introduced in Figure 4, which shows the relationship between Citi’s MCI for China and deviation of global commodity prices from their 200 day moving average. The growing dominance of China in global commodity markets has been a theme for the past fifteen years, so in a sense it is not news to focus on the China-commodities nexus. But it is worth revisiting simply to make this point: that China’s share of global commodities imports has increased in spite of the fall in commodity prices that took place between 2011 and 2016 (Figure 5); and in spite of the slowdown in the Chinese economy during these years. Of course it makes intuitive sense that China’s share of global commodity imports rose sharply after the 2008 crisis, but it is more surprising that its share has increased so steadily since then. The effect that all this has had on EM is visible from Figure 6. Although manufacturing exporters within EM became more attached to China during the past 15 years because of integrated regional value chains, the rise in the dependence of EM commodity exporters is even more dramatic, to the point where it is now the case that commodity exporters send as big a share of their exports to China as manufacturing exporters do.
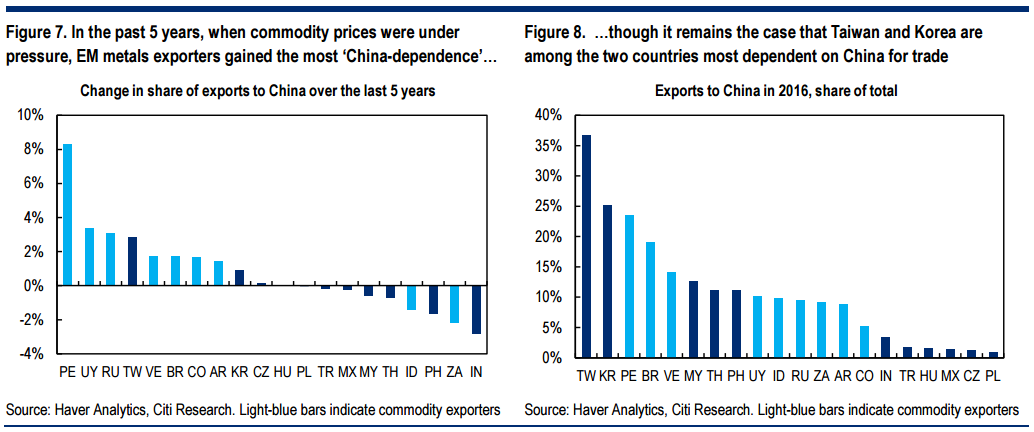
The rise in the dependence of EM commodity exporters on China is concentrated for the most part among metals exporters. This follows from the aggregate picture that emerges from Figure 5: the increasing role that China plays in global commodities markets is concentrated in metals. This is echoed in Figure 7, which ranks emerging economies according to the increase in their dependence on exports to China during the past five years. The countries whose Chinadependence has increased the most are clustered among metals exporters. This is obviously the case for Peru and Brazil. The increase in Russia’s dependence on China is primarily explained by rising oil exports (Russia replaced Saudi Arabia last year as China’s principal supplier of crude); and Uruguay’s increased Chinadependence results from higher beef and soya exports. Yet it remains the case that Korea and Taiwan have among the closest overall trade links with China (Figure 8). This is true in overall terms, and is also probably still true in terms of the amount of domestic value-added that is exported to China (the OECD’s Trade in Value Added database runs until 2011, but in that year it was the case that exports to China from Korea and Taiwan included more domestic value-added than from anywhere else).
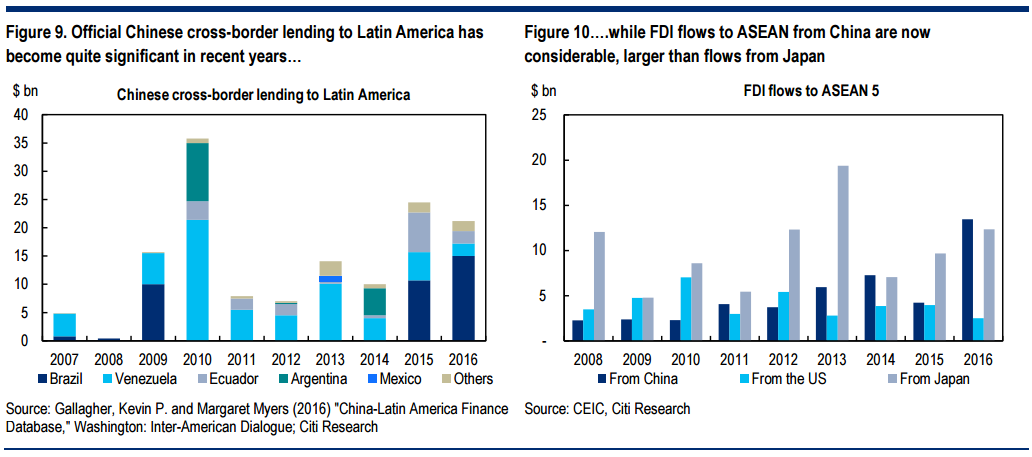
Financial dependence on China is growing, but difficult to document. The idea that China is becoming a substitute source of external financing for emerging economies is a plausible one, but it is difficult to measure. Although Chinese banks now report to the BIS, the necessary breakdowns are often not available. There are patchy data. The Inter-American Dialogue’s China-Latin America Finance Database, for example, documents that lending by the China Development Bank and the China Export-Import Banks to Latin America and the Caribbean amounts to $141 bn since 2007, of which $62 bn went to Venezuela; $37 bn to Brazil; and $17 bn and $15 bn to Ecuador and Argentina respectively. This is a substantial number: for comparison, the Institute of International Finance’s estimate is that total crossborder net bank lending to Latin America during the last 10 years was $233 bn. Yet there are no data we’re aware of that specify China’s FDI flows into the region2 . For ASEAN, by contrast, Chinese FDI is arguably increasing ‘China-dependence’ in a more significant way. The ASEAN 5 received $13.5 bn of Chinese FDI in 2016 compared to $2.3 bn from the US; it was the first year in which FDI from China was greater than that from Japan (Figure 10).
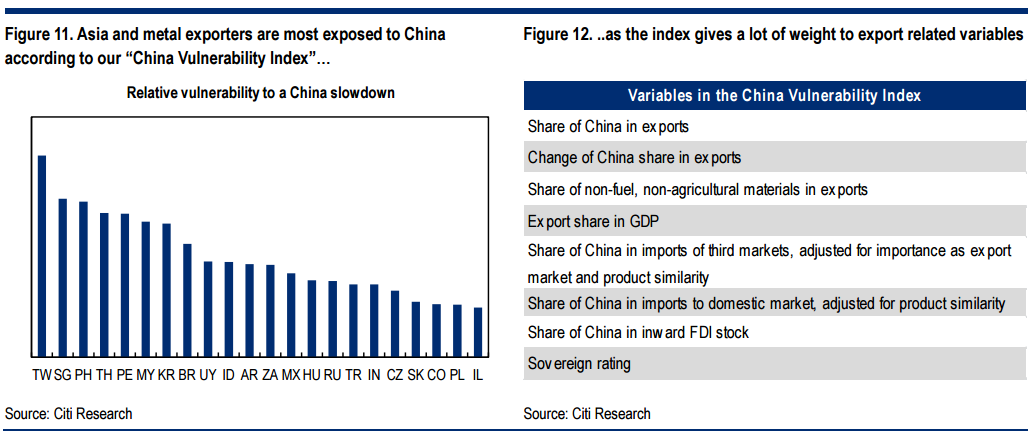
We try to capture EM’s sensitivity to a China shock by putting together a ‘China Vulnerability Index’ (Figure 11). Since we believe that the main impact would be through ‘real’ rather than financial channels, it is real variables that constitute the bulk of the index. The index has 8 variables, equally weighted (Figure 12). First we account for a country’s general export dependence, and then look at the share of exports going to China and how this share has changed over the last five years (on the assumption that countries whose trade has become more dependent on China in recent years might be most affected by a decline in trade). Then we take into account the share of non-fuel and non-agricultural crude materials in exports, where China’s role in global demand is greatest. Lackluster demand from China would harm exporters of these commodities, mostly metals, not only through the direct volume channel, but also by reducing the price exporters can receive for these commodities everywhere else in the world. A deceleration in growth might also incentivize Chinese exporters to increase their market shares abroad. We therefore also account for competition from Chinese producers, both in the respective countries’ domestic market, as well as in contested third markets. We measure this potential for increased competition by looking at the share of China in imports as well as the share of China in the market for tradable goods in third countries, weighted by the relative importance of these markets for exports from the respective country. Additionally, we adjust these market shares for the degree of product similarity with China, accounting for the fact that manufacturers, e.g. producers of telecommunication equipment, would feel the competition of Chinese firms more than commodity producers. We also account for investment linkages by including the share of China in the stock of a country’s inward FDI. Finally, we include a country’s sovereign rating in the model, on the grounds that a country’s vulnerability to a China-related shock is likely to be magnified by its overall vulnerability to a shock; and the sovereign rating is a reasonable proxy for that overall vulnerability.
Asia would, obviously, be worst-affected by a China shock; but metals exporters should beware. The results of our ‘China Vulnerability Index’ are broadly intuitive: Taiwan, Singapore, the Philippines and Thailand rank highest, though there are a number of metals exporters – Peru, Brazil, for example – who are also showing high degrees of vulnerability. Korea is relatively well-protected compared to other Asian economies largely because it is a more closed economy than Singapore or Taiwan or Thailand. Within Asia, it is the relative robust position of India that stands out; and outside Asia, it is the relative vulnerability of Peru that is most striking.
Straya should be on the list too. It may have formerly been a developed market but it’s the world’s only de-merging market today, striding backwards on living standards, institutional stability, economic diversity, corruption and transparency.
Anyways, the above is why I see the current bid under EM equity and debt as mis-allocation…
David Llewellyn-Smith is Chief Strategist at the MB Fund and MB Super. David is the founding publisher and editor of MacroBusiness and was the founding publisher and global economy editor of The Diplomat, the Asia Pacific’s leading geo-politics and economics portal.
He is also a former gold trader and economic commentator at The Sydney Morning Herald, The Age, the ABC and Business Spectator. He is the co-author of The Great Crash of 2008 with Ross Garnaut and was the editor of the second Garnaut Climate Change Review.