Arrears Trends: The Big Picture The Standard & Poor’s Performance Index (SPIN) for Australian prime mortgages rose to 1.15% at the end of fourth quarter (Q4) 2016 from 1.14% in Q3. The SPIN measures the weighted-average arrears more than 30 days past due on residential mortgage loans in publicly and privately rated Australian RMBS transactions. S&P Global Ratings calculates the SPIN for prime and nonconforming residential mortgage loans. Home loan arrears normally start to rise toward the end of Q4 and remain elevated until the end of Q1. We expect GDP growth and unemployment rates in 2017 to remain relatively stable, at 3.0% and 5.5%, respectively (table 1), but arrears are likely to rise, ignoring seasonal variations, toward their decade-long average of 1.25% (chart 1). Low rates of mortgage arrears in New South Wales and Victoria, which account for about 55% of total prime RMBS exposures, are supporting the relatively stable performance of the SPIN, and this is helping to offset higher arrears in states that have a greater exposure to the resources sector. The majority of underlying loans in the portfolio are variable-rate mortgages, and a rise in interest rates is likely to exacerbate debt serviceability pressures, particularly for borrowers with higher loan-to-value (LTV) ratios and limited refinancing prospects.
Arrears on nonconforming residential mortgage-backed securities (RMBS) rose to 4.43% in Q4 from 4.36% in Q3. Nonconforming arrears were down 4.3% year on year to 4.43%, and remain well below their financial crisis peak of 17.09%. Lower arrears in this sector have coincided with high prepayment rates; the average for 2016 was more than 29%. Higher prepayment rates often indicate strong refinancing activity, particularly in the nonconforming space, as borrowers switch to lenders offering more competitive rates. Prepayment rates averaged around 35% in the nonconforming sector before the 2008 financial crisis, reflecting the strong competitive pressure at the time. Prepayment rates have fallen since the crisis, reflecting a general tightening in lending criteria and limiting the refinancing prospects of many nonconforming borrowers. In more recent years, the improved credit profile of many nonconforming borrowers, which is indicated by the lower arrears performance in the sector, has improved their refinancing prospects, contributing to higher prepayment rates.
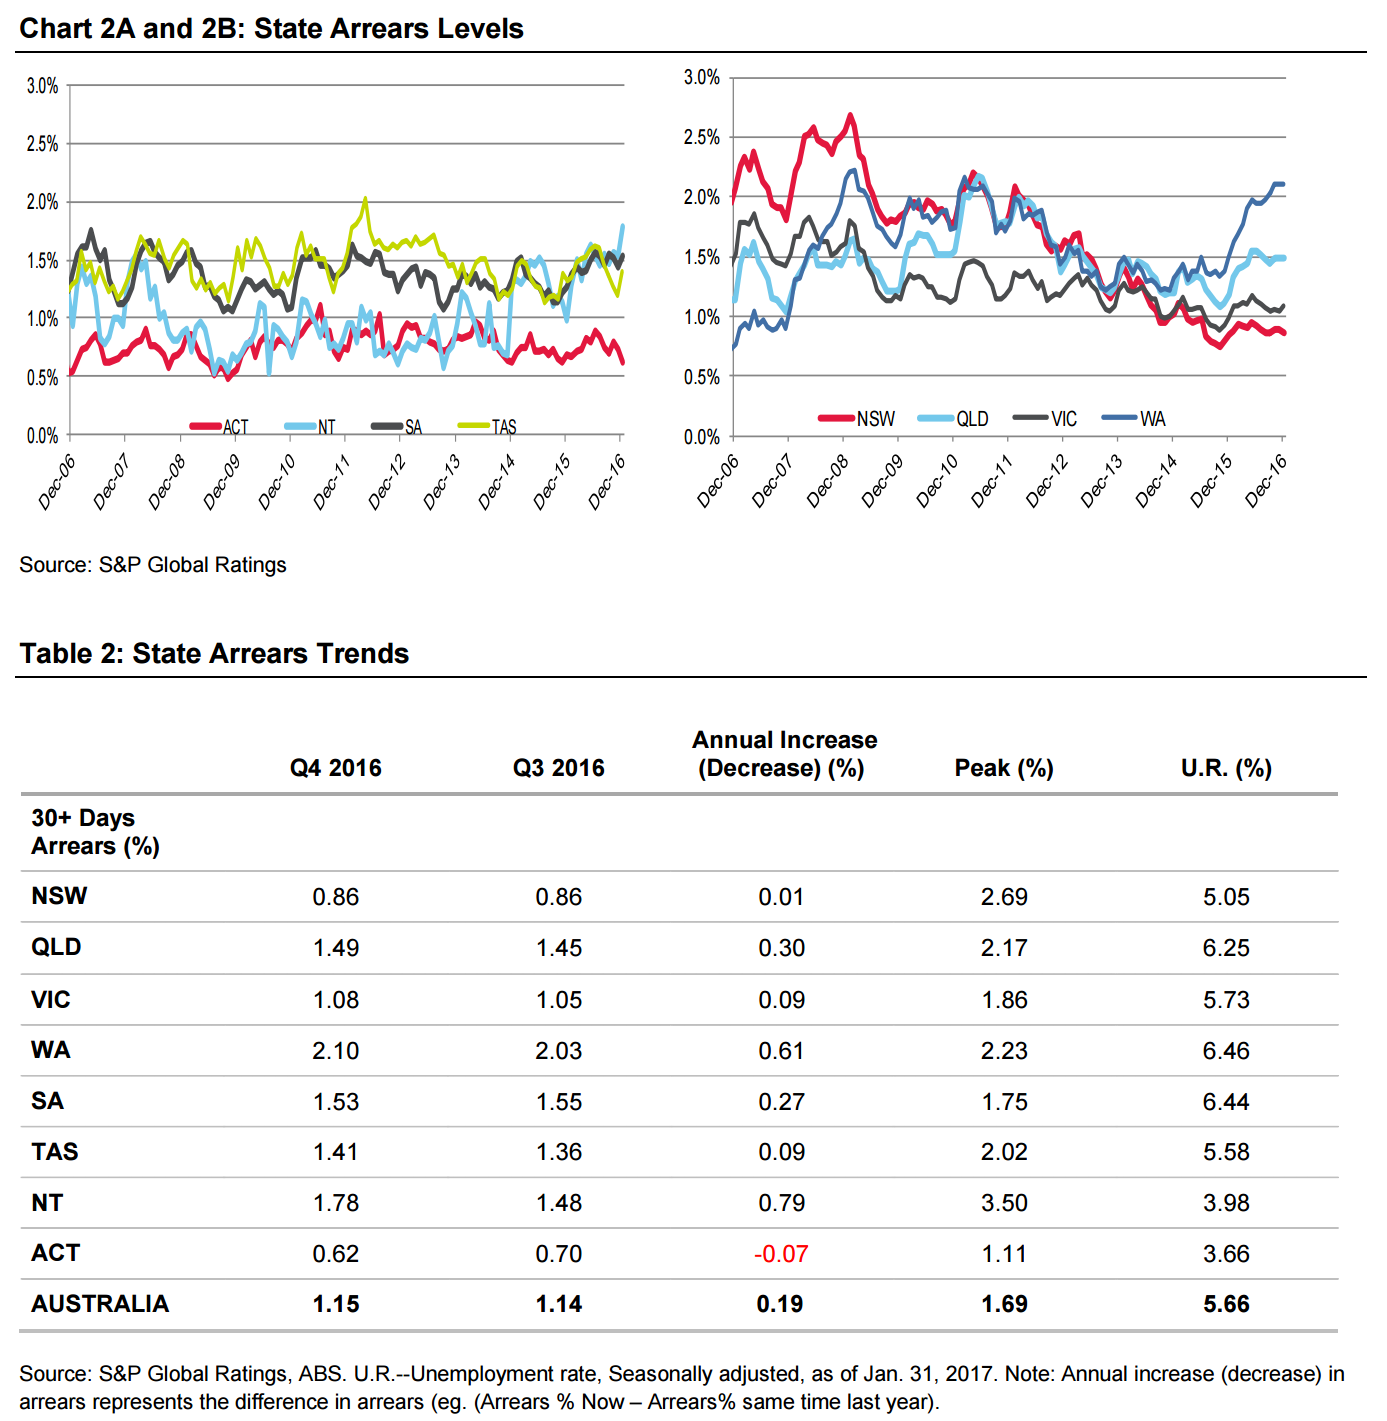
State Of Play
The Australian Capital Territory (ACT) in Q4 2016 again had the lowest arrears of all the states and territories, at 0.62%. Western Australian meanwhile recorded arrears of 2.10%, the nation’s highest for the seventeenth consecutive month. Arrears increased in all states and territories during Q4, except the ACT and South Australia Each state and territory’s arrears level is a reflection of its general economic health and provides an insight into households’ ability to manage their debt in a changing economic environment. A breakdown of the arrears performance for each state and territory shows:
• New South Wales (NSW) maintained a fairly stable level of arrears during Q4, at 0.86%. Arrears in NSW have been trending below 1% since June 2015. Strong arrears performance has occurred alongside robust employment growth, with unemployment rates in NSW the lowest in the country, excluding the territories, as of Dec. 31, 2016. While the market remains concerned about in the country’s most expensive property market “overheating,” we see this as less of a risk for most of the loans that underlie Australian RMBS transactions. A relatively modest weighted-average LTV ratio of around 60% and high seasoning of around 60 months for the portfolio provides a degree of insulation against a downturn in property prices. This is particularly the case in Sydney, which is a proxy for New South Wales, where property price growth has been strong.
• Victoria’s arrears increased in Q4, but at 1.08% remain below the SPIN. Victoria’s population growth and, by extension, property price growth are the highest among the states and territories, based on current data. Lower wage growth and an unemployment rate that is currently higher than the national average could temper this to some degree.
• Queensland’s arrears rose in Q4. Arrears and unemployment levels in Queensland are at the higher end of the spectrum. With the most decentralized population and more than 50% of the RMBS exposure to this state being outside of Brisbane, higher arrears reflect the greater exposure to regional areas, many of which are facing high unemployment levels and subdued economic growth. On a more positive note, annual wage growth improved in Queensland in December to 2.0%
• Western Australia (WA) in Q4 recorded the highest arrears for the seventeenth consecutive month. Higher unemployment, lower wage growth, and falling property prices are creating mortgage stress in WA, as evidenced by the state’s higher arrears. While the price of bulk commodities has increased significantly during the past year, we do not expect it to translate into materially higher investment or employment in the resources sector, as outlined recently by the Reserve Bank of Australia (RBA). This means higher arrears in WA are likely to persist for some time, as the downturn in mining investment continues to take effect.
• South Australia (SA)’s mortgage arrears fell in Q4. An improvement in the unemployment rate in recent months has probably helped to keep a lid on arrears, which are the third highest in the country as of Q4, at 1.53%.
• Tasmania’s arrears increased to 1.41% during Q4, but key economic indicators appear to be more optimistic across the Tasman. Tasmania has seen an improvement in its economic conditions, as evidenced by its improving unemployment rate, which was down 15.6% year on year as of Jan. 31, 2017, annual wage growth, and property prices. We do not know the degree to which this translates to an improvement in arrears, but economic fundamentals appear to support better arrears performance.
• Northern Territory (NT)’s arrears rose 0.30% to 1.78% in Q4, up from 1.48% in Q3. Given the small exposure in RMBS portfolios to the NT, arrears trends are more volatile in percentage terms.
• Australian Capital Territory (ACT) arrears fell to 0.62% in Q4 from 0.70% in Q3 and remain the lowest in the country. With the public service as a key employer in the nation’s capital, local employment conditions are likely to be more stable than other states and territories, particularly those with a higher exposure to the resources sector. Arrears in the ACT have been below 1% since July 2012, and we expect them to remain below the prime SPIN because the workforce has greater mobility and job security than industries such as manufacturing and mining.
There is only one way for eastern Australia to go and it is not down.
David Llewellyn-Smith is Chief Strategist at the MB Fund and MB Super. David is the founding publisher and editor of MacroBusiness and was the founding publisher and global economy editor of The Diplomat, the Asia Pacific’s leading geo-politics and economics portal.
He is also a former gold trader and economic commentator at The Sydney Morning Herald, The Age, the ABC and Business Spectator. He is the co-author of The Great Crash of 2008 with Ross Garnaut and was the editor of the second Garnaut Climate Change Review.