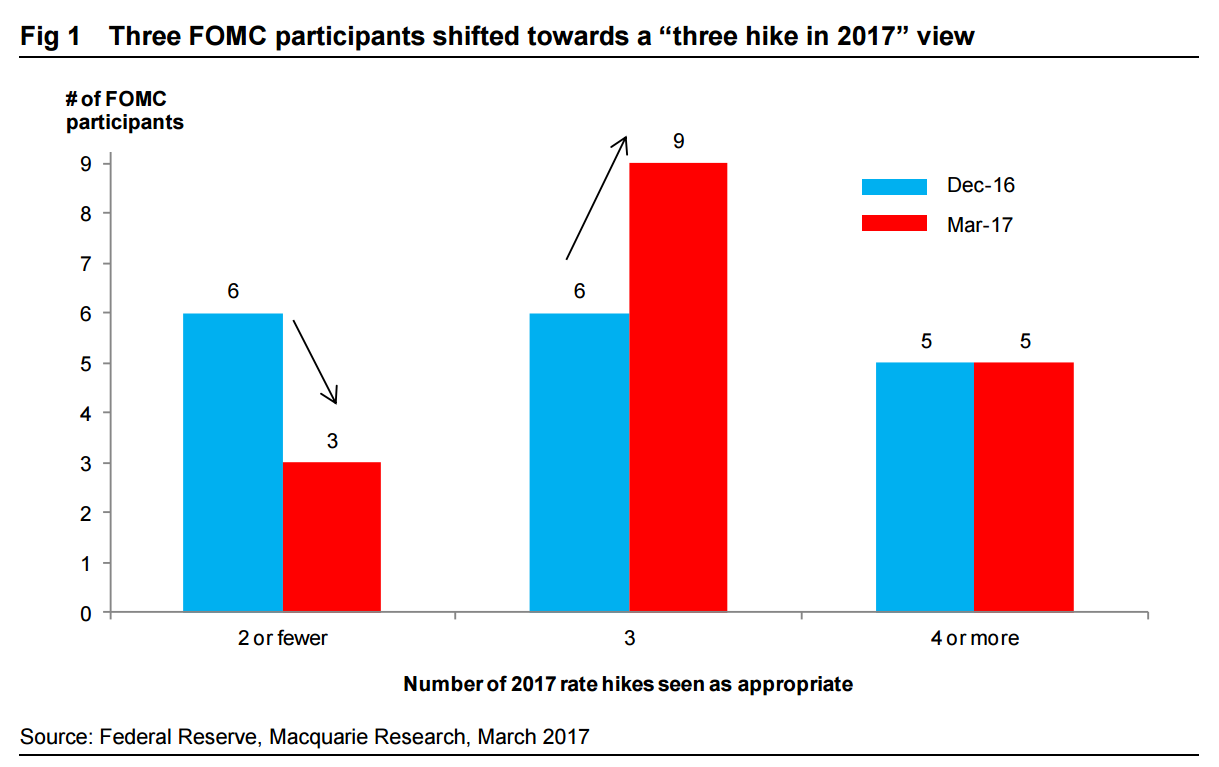
We hold our base case (updated last week) for a total of three federal funds rate hikes in 2017. Shifts in the updated dot plot for the end-17 federal funds rate (Fig 1) illustrates that three FOMC participants shifted their assessment of appropriate policy in 2017 from two hikes to three hikes. We believe this group includes influential FOMC members Chair Yellen and FRBNY President Dudley. The widely followed, “median dot”, was effectively unchanged for 2017-19 (Fig 2).
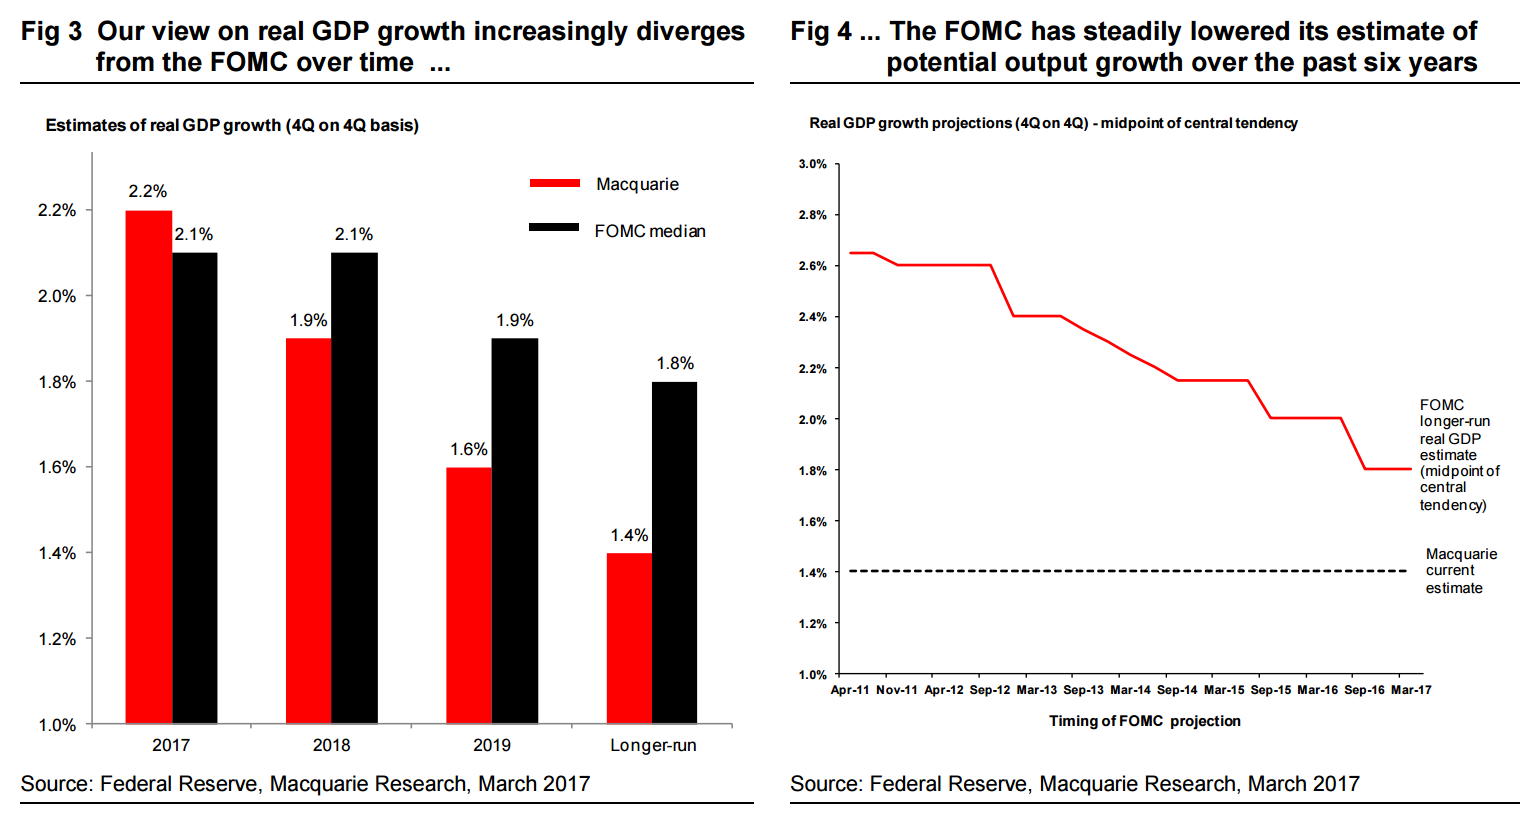
For 2017, our views are broadly in line with that emphasized by the FOMC. As outlined in Fortress America: Demographics, lower potential, and the Fed, it is beyond this where we diverge. Our estimate for real-GDP growth moves increasingly below the median FOMC estimate in 2018 and beyond (Fig 3). Our longer-run real GDP growth estimate is 1.4%, fully 40 bps less than the FOMC’s, which has steadily declined over the past six years (Fig 4).
Demographics are driving potential output growth even lower
Underpinning our views on lower potential output is analysis of supply-side constraints. In particular, even assuming a considerable rebound in core working age (25-54 year old) participation (back to 2005-7 levels), our analysis shows that just 120K jobs per month are needed to hold the unemployment rate steady in 2017. This number (“monthly breakeven jobs growth”) falls steadily in subsequent years, before stabilizing at just ~45K per month in 2020.
Demographic forces are likely to drive continued downward pressure on potential output. Fully 90% of working age (16 & over) population growth is occurring amongst the 65 & older age cohort. Retirements from this older age group places downward pressure on the number of jobs required to maintain a stable unemployment rate and by extension on potential output growth.
These demographic forces have not impacted the pace of jobs growth in recent years because slack had been considerable. As outlined in Running out of slack, the outlook has begun to shift, with rising signs that full employment is approaching, even after adjusting for potential returnees to the labour force.
Lower equilibrium yields mean a flattening yield curve
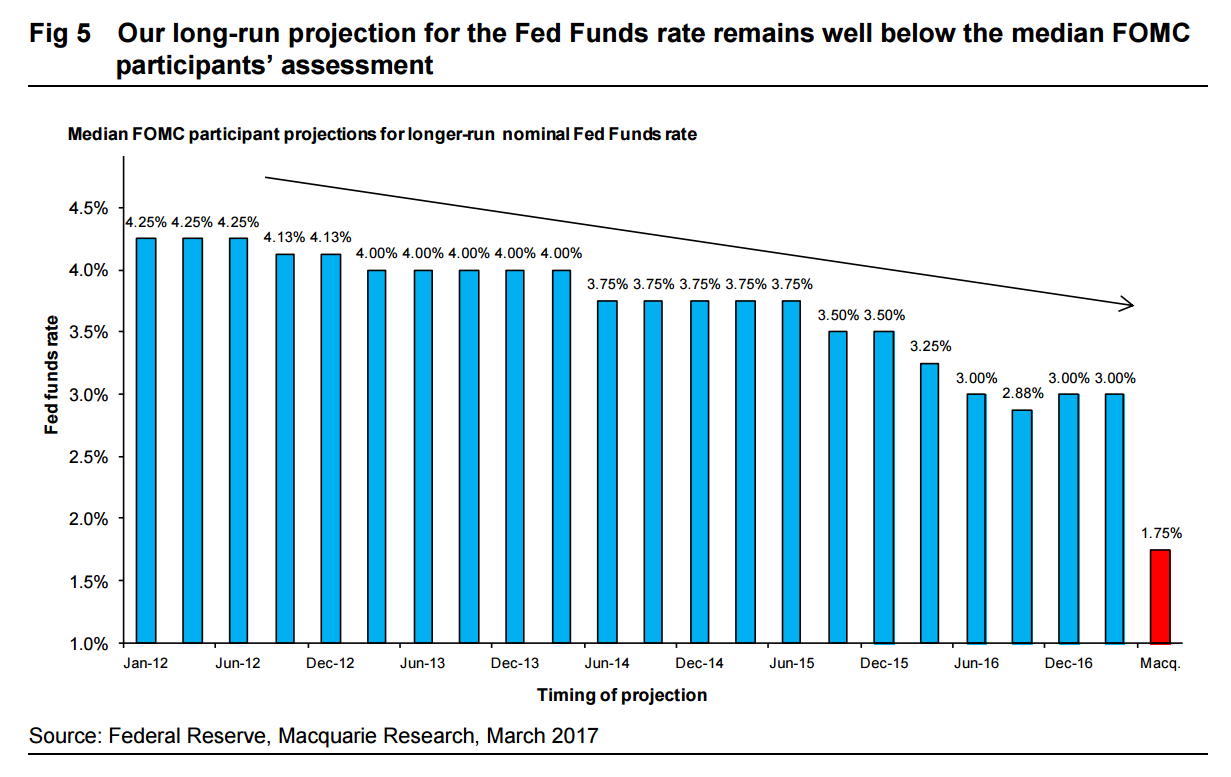
Our views on lower potential output growth underpin our estimate for the end-cycle neutral fed funds rate of the 1.5 to 1.75% range (current FOMC estimate is 3%) (Fig 5). Over time, as the capacity constraints on the economy imposed by demographics intensify and become more apparent, we believe rather than rising (as the FOMC anticipates), the neutral policy rate will decline modestly. This will result in the FOMC moving towards accepting a lower neutral rate, as it has gradually been over the past five years.
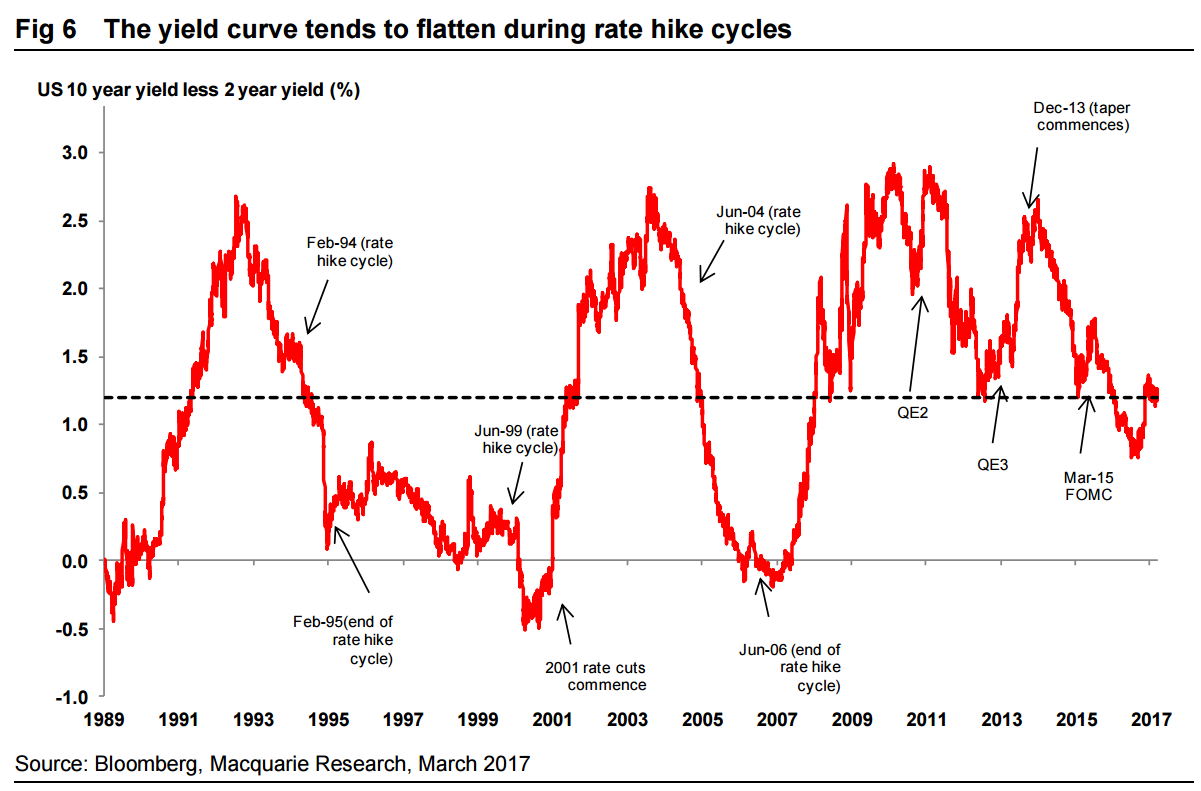
Alongside this we believe the 10-year treasury yield will find an equilibrium or “fair value” at 2.3%, well below consensus of 3.5%. The combination of further hikes in 2017 and lower equilibrium yields suggest the yield curve should flatten through the remainder of the year (Fig 6). This is consistent with what has typically occurred during Fed rate hike cycles over the past 30 years and in our assessment should support a more defensive allocation within equities.
That is a reasonable base case with fiscal support. So that would have the US two year yield at 1.75% within a year or so and, given we’ll probably see further flattening at the long end, by this time next year we’ll be dangerously close to curve inversion and the next recession signal…
David Llewellyn-Smith is Chief Strategist at the MB Fund and MB Super. David is the founding publisher and editor of MacroBusiness and was the founding publisher and global economy editor of The Diplomat, the Asia Pacific’s leading geo-politics and economics portal.
He is also a former gold trader and economic commentator at The Sydney Morning Herald, The Age, the ABC and Business Spectator. He is the co-author of The Great Crash of 2008 with Ross Garnaut and was the editor of the second Garnaut Climate Change Review.