
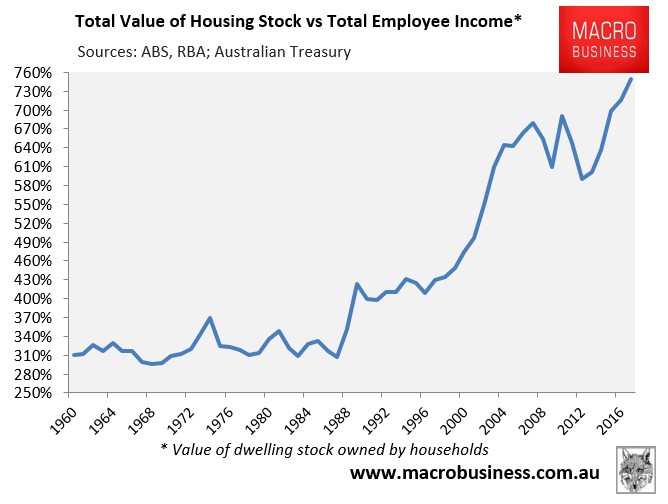
The ABS yesterday released its property price data for the December quarter, which valued Australia’s dwelling stock owned by households at a record $6.11 trillion dollars.
As shown below, the total value of Australia’s dwelling stock was an all-time high 7.5 times incomes as at December 2016, up from 7.1 times incomes a year prior:
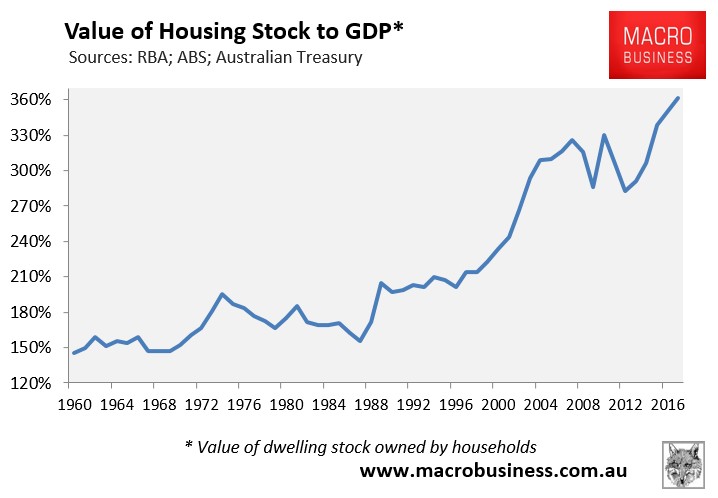
Similarly, the ratio of dwelling values against Australian GDP hit a record 3.6 times as at December 2016, up from 3.5 times GDP a year prior:
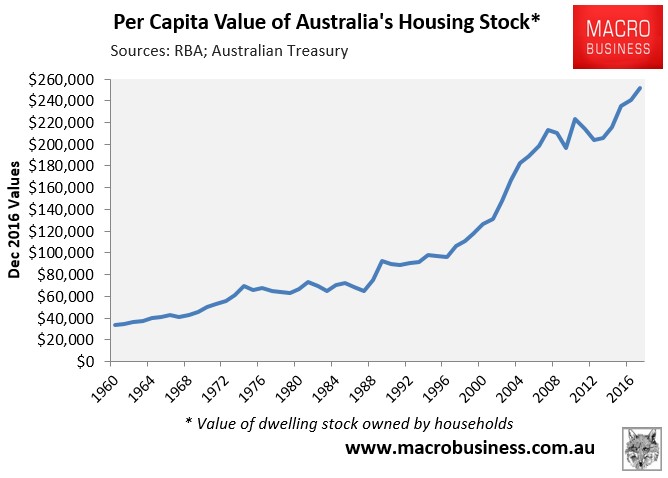
When divided by Australia’s population, Australian housing was worth a record $252,000 per man, women and child:
Australia’s house prices are also showing a record divergence from rents:
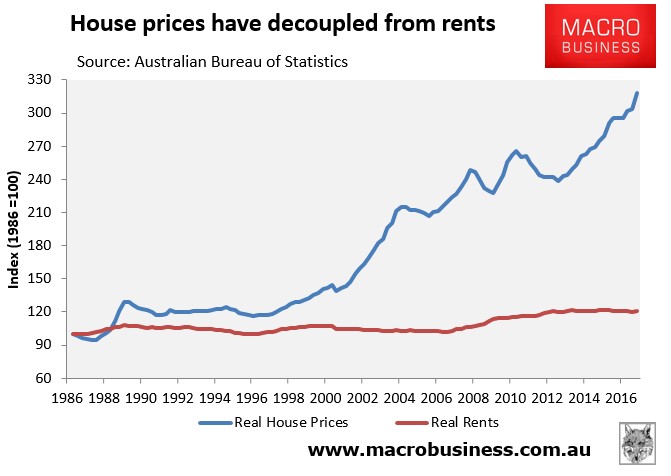
In fact, since Australian house values bottomed in September 2012, prices have risen by 34% in real terms versus only a 1% increase in real rents.
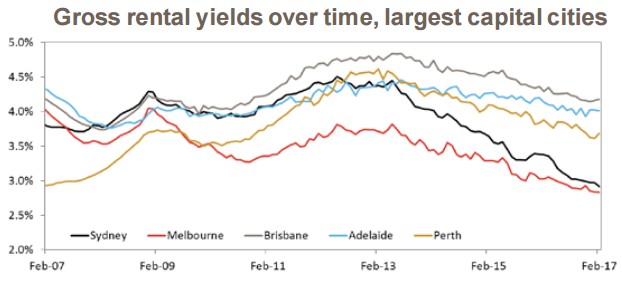
While the ABS doesn’t keep data on rental yields, CoreLogic does. And unsurprisingly, gross rental yields have plummeted over recent years to an all-time low 3.1%:
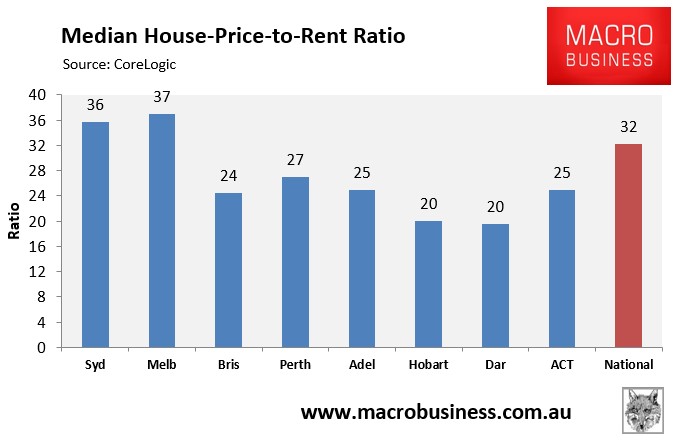
And this has taken the value of Australian houses to an insane 32-times rents nationally, led by Sydney and Melbourne, up from 29-times a year ago:
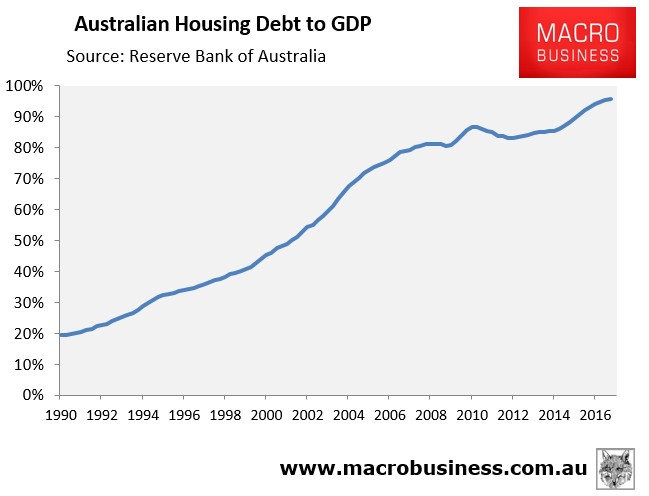
Meanwhile, the mortgage debt underpinning Australia’s housing values hit an all-time high 96% of GDP as at December 2016, up from 92% of GDP a year earlier:
This is one helluva bubble!
