Jamie Alcock, Associate Professor at the University of Sydney, has penned a highly spurious article claiming that housing affordability for today’s home buyers is better than when their baby boomer parents purchased. From The Conversation:
A house in 2017 that costs nine times the median salary, when mortgage interest rates are less than 4%, is arguably more affordable than a house in 1990 that costs six times the median salary. Interest rates in 1990 were 17%.
Consider this simple example. In 1990 a first home buyer purchases an average house in Sydney priced at A$194,000. With mortgage interest rates at 17%, the monthly mortgage repayments were A$2,765 for a 30-year mortgage. But in 1990 the average full-time total earnings was only A$30,000 per annum, so the buyer’s mortgage repayments represented over 111% of before-tax earnings. In 2017 a first home buyer purchasing a Sydney house for A$1,000,000, with interest rates at 4%, is only required to pay A$4,774 every month, or 69% of their before-tax average full-time total earnings.
So, relatively, houses are substantially more affordable today than they were in 1990. The lower interest rate means the costs of servicing a mortgage is lower today than it was 25 years ago, or even 50 years ago…
In 1990 mortgage interest rates were at a record high and so our first home buyer could reasonably expect their repayments to decrease in the coming years. They could also reasonably expect that, as mortgage interest rates fell, demand for housing would increase (all else being equal) and so would house prices, generating a positive return on their investment.
But our 2017 first home buyer is buying when interest rates are at record lows. They cannot reasonably expect interest rates will fall or for their repayments to go down in future years. It’s also unlikely that house prices will increase as they have for previous generations.
So while the current generation of first home buyers find housing much more affordable than their parents, they face substantially higher interest-rate risk and a worse outlook for returns on their investment. If we wish to address the concerns of first home buyers we should look into these issues rather than exploiting misrepresentative median-based measures of house affordability.
There are so many errors and omissions with this article that it is hard to know where to start. But here goes.
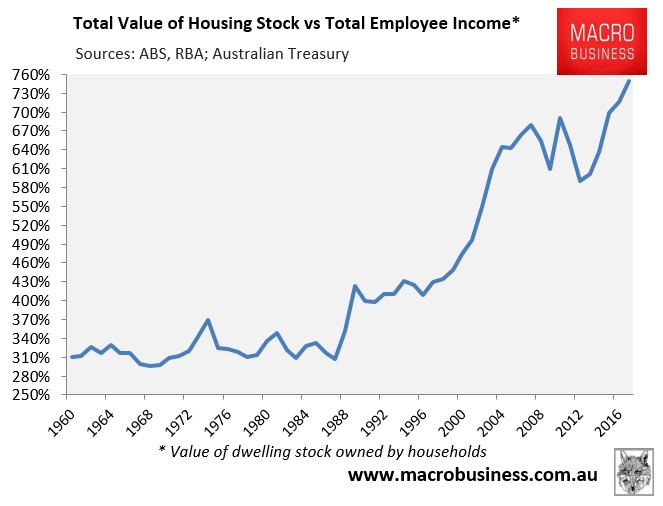
First, Alcock claims that houses today are roughly 50% more expensive against incomes than they were in 1990. The data, however, shows that houses today are nearly twice as expensive:
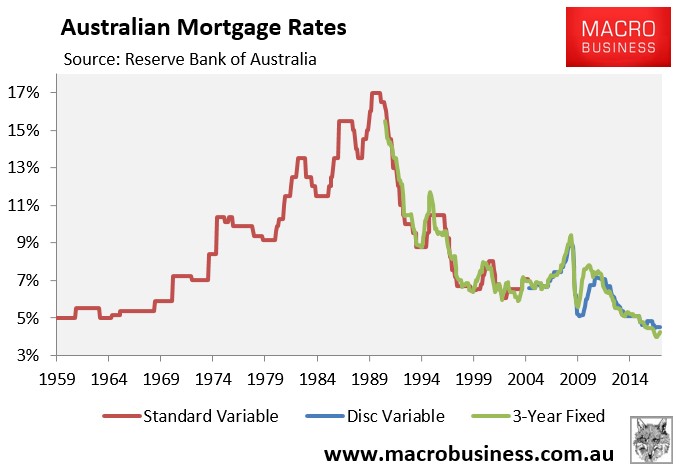
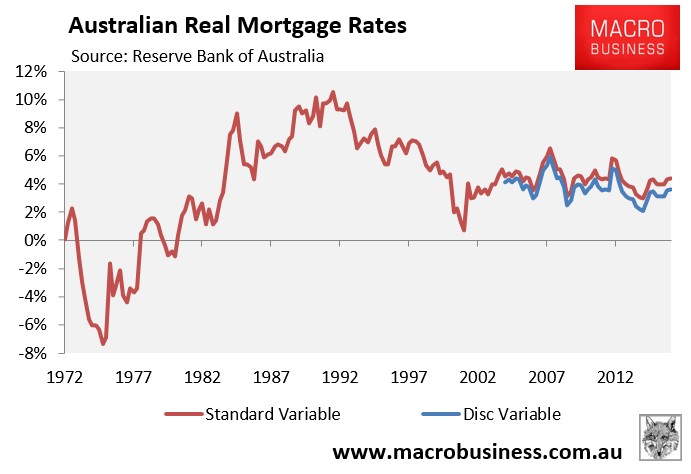
Second, Alcock claims that mortgage rates today are “less than 4%” versus 17% in 1990. However, a quick look at the RBA’s indicator lending rates shows that the discount variable mortgage rate for owner-occupiers is in fact 4.5% – a significant difference.
It would be nice if Alcock used the correct data to begin with.
Third, I love the way Alcock conveniently compared initial repayments on mortgages taken-out today (albeit using wrong data) against repayments during 1990 when mortgage rates were the highest in Australia’s history, as if this is representative of the typical baby boomer experience, rather than an anomally:
It is highly misleading to present housing affordability in this way.
As Alcock himself acknowledges, mortgage rates in 1990 did not stay sky-high for long and a home buyer back then got to enjoy the benefit of a massive drop in mortgage rates over subsequent years and a corresponding massive rise in home values. There’s no way today’s first home buyer will experience similar conditions in the years ahead, whereby mortgage rates fall by two-thirds and values grow almost exponentially.
Moreover, average earnings growth is hovering around its lowest level in recorded history:
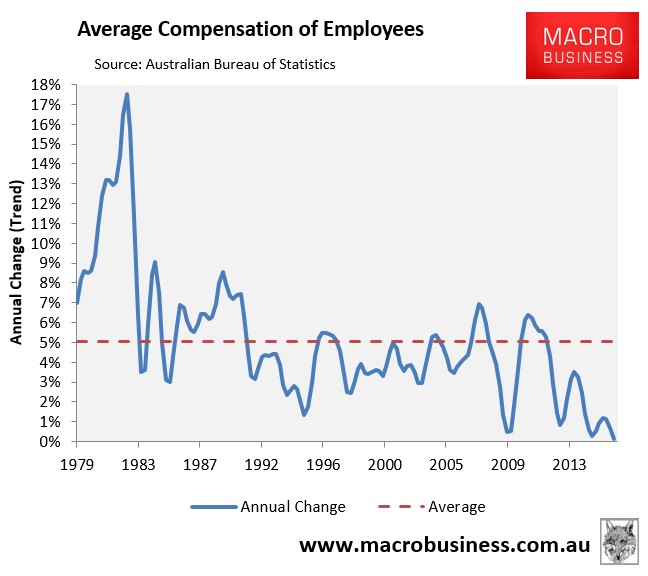
This means that it is going to be far more difficult for today’s mega-mortgage slaves to pay off their loans. A huge mortgage today will remain a very big mortgage in a decade’s time.
Fourth, the inherent problem with Alcock’s housing affordability claim is that he only takes into consideration initial repayments on new mortgages, not repayments over the full 25 or 30 year loan term.
To illustrate why this is nonsensical, consider the below extreme stylised example, which comes from last year’s special report: Why common housing affordability measures are wrong.
Scenario A (very low price, very high inflation, extreme mortgage rate):
- Buyer has an annual income of $100,000.
- They buy a house valued at $300,000, (assume no deposit).
- The mortgage rate is 17%, which remains the same throughout the 25 year loan-term.
- Inflation is very high and wages grow at 7% annually (i.e. 10% real mortgage rate).
Scenario B (high price, very low inflation, very low mortgage rate):
- Has an annual income of $100,000.
- They buy a house valued at $700,000 (assume no deposit).
- The mortgage rate is 3.5%, which remains the same throughout the 25 year loan-term.
- Inflation is low and wages grow at 2% annually (i.e. 1.5% real mortgage rate).
In case you haven’t noticed, Scenario A is an extreme proxy for the late-1980s home buyer, whereas Scenario B is an extreme proxy for today’s home buyer.
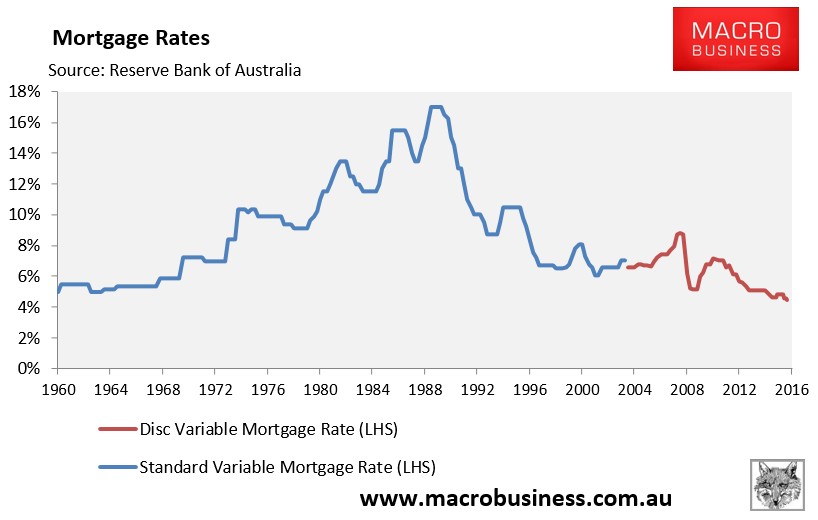
It should be noted at the outset that while mortgage rates briefly hit 17% in 1989-90, they did not stay there for long. They have also never been as low as the 3.5% assumed above (4.5% is the lowest they have reached):
Similarly, real mortgage rates were only 10% briefly throughout the late-1980s and early 1990s (see next chart).
Nevertheless, even in the extreme example above, the buyer in Scenario A only pays more in mortgage repayments for the first six years (see next chart).
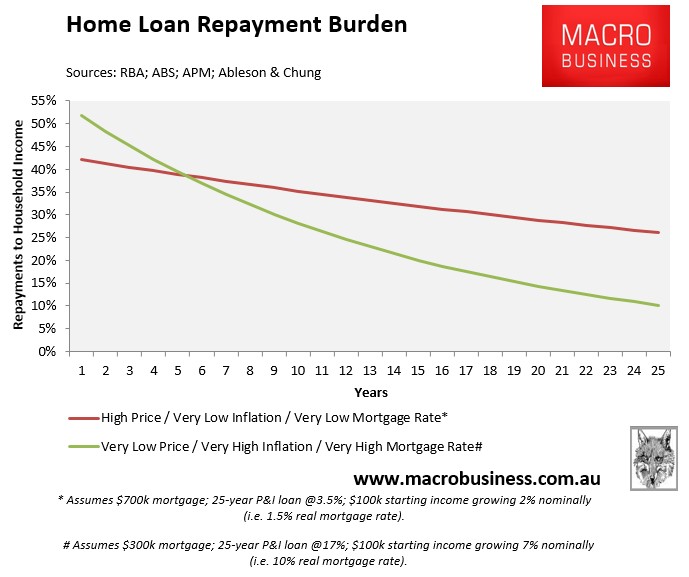
Thanks to the wonders of high nominal inflation and wages growth (and even in the face of a 10% real mortgage rate), Buyer A’s mortgage debt is inflated away quickly such that their mortgage repayments are:
- 28% of income after 10 years;
- 20% of income after 15 years;
- 14% of income after 20 years; and
- 10% of income in the final year.
Buyer B is not nearly as lucky, since their repayment burden remains high in the face of low inflation and low wages growth, even though they face a ridiculously low real mortgage rate of just 1.5%. Buyer B’s mortgage repayments are:
- 35% of income after 10 years;
- 32% of income after 15 years;
- 29% of income after 20 years; and
- 26% of income in the final year.
Therefore, low inflation and low nominal wages growth – as exists currently – means that a huge mortgage taken-out today will remain a very big mortgage for decades to come.
Coincidentally, today’s home buyer also faces the worst mortgage repayment burden in recorded history (again, see October’s special report for specifics):
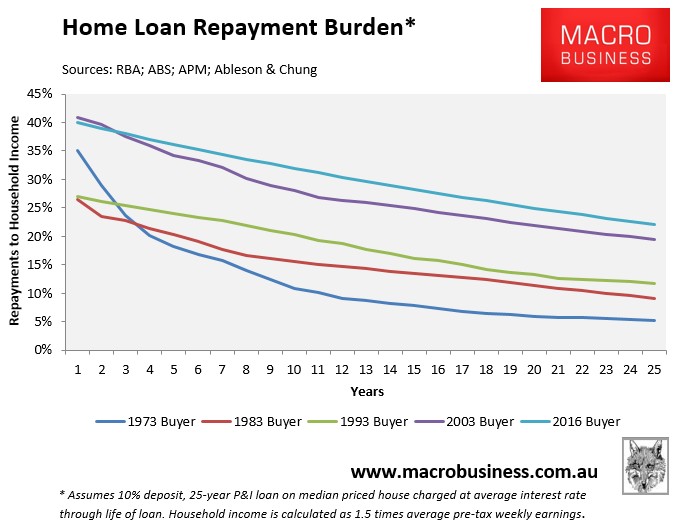
When talking about housing affordability, analysts must consider the mortgage repayment burden over the life of the loan rather than only at the very beginning. Alcock has failed in this regard.
Rather than low inflation/interest rates being a benefit to today’s home buyer, it will instead act as a millstone around their mortgaged necks for decades to come.
