The following data is calculated from the Fed’s Flow of Funds data (released today) and the BEA supplement data on single family structure investment. This is an aggregate number, and is a combination of homeowners extracting equity – hence the name “MEW” – and normal principal payments and debt cancellation (modifications, short sales, and foreclosures).
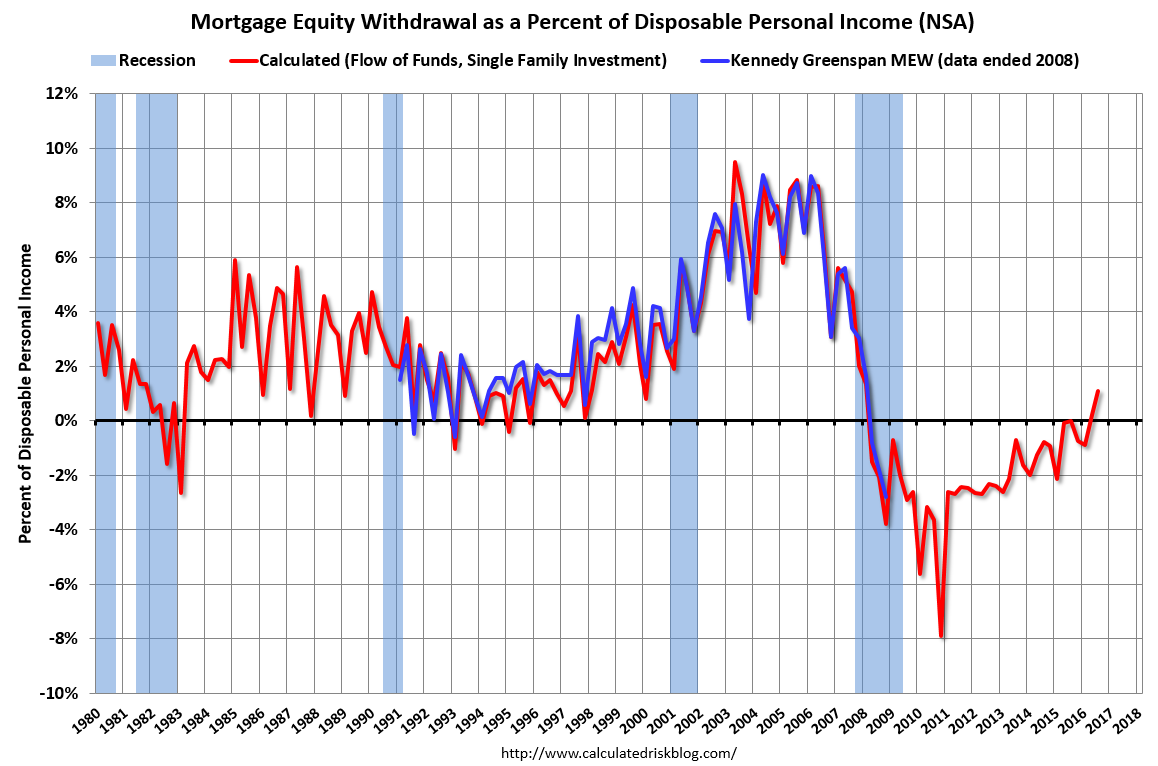
For Q3 2016, the Net Equity Extraction was a positive $39 billion, or a positive 1.1% of Disposable Personal Income (DPI) . This is only the second positive MEW since Q1 2008.
This graph shows the net equity extraction, or mortgage equity withdrawal (MEW), results, using the Flow of Funds (and BEA data) compared to the Kennedy-Greenspan method.
Note: This data is impacted by debt cancellation and foreclosures, but much less than a few years ago.
The Fed’s Flow of Funds report showed that the amount of mortgage debt outstanding increased by $86 billion in Q3.
The Flow of Funds report also showed that Mortgage debt has declined by almost $1.2 trillion since the peak. This decline is mostly because of debt cancellation per foreclosures and short sales, and some from modifications. There has also been some reduction in mortgage debt as homeowners paid down their mortgages so they could refinance.
With a slower rate of debt cancellation, MEW will likely stay positive.
David Llewellyn-Smith is Chief Strategist at the MB Fund and MB Super. David is the founding publisher and editor of MacroBusiness and was the founding publisher and global economy editor of The Diplomat, the Asia Pacific’s leading geo-politics and economics portal.
He is also a former gold trader and economic commentator at The Sydney Morning Herald, The Age, the ABC and Business Spectator. He is the co-author of The Great Crash of 2008 with Ross Garnaut and was the editor of the second Garnaut Climate Change Review.