
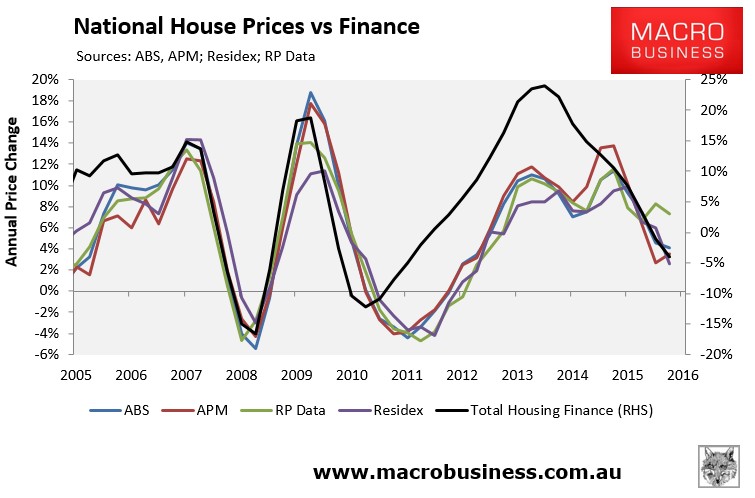
Over the past six month, I have presented data showing that the historical relationship between dwelling prices and the value of housing finance commitments (excluding refinancings) has broken down somewhat over the latest housing cycle, at least in relation to the CoreLogic index:
I also teased two potential explanations for this breakdown:
- falling transaction volumes, whereby falling finance commitments are chasing even fewer homes, thus resulting in still-rising prices; and
- the potential for cash buyers, such as buyers from overseas, whom are not captured in the housing finance statistics.
Today, I want to focus on the first explanation: falling transaction volumes, which are illustrated below using the latest ABS data, released on Tuesday.
First, the below charts show the quarterly number of dwelling transfers at the national capital city level, as well as at the individual capital city level:
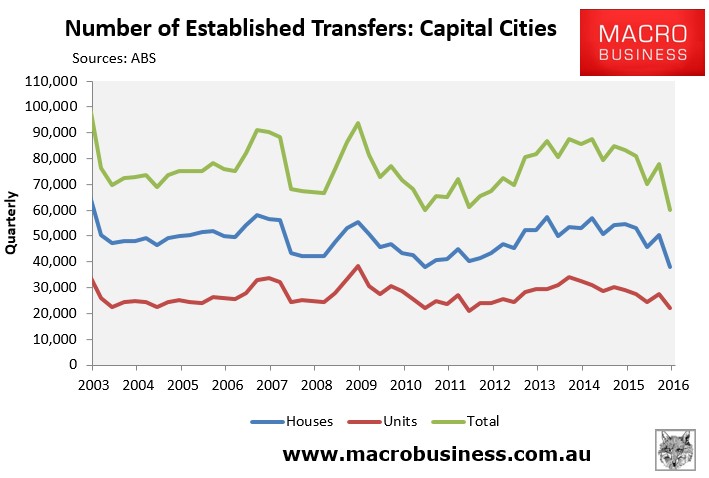
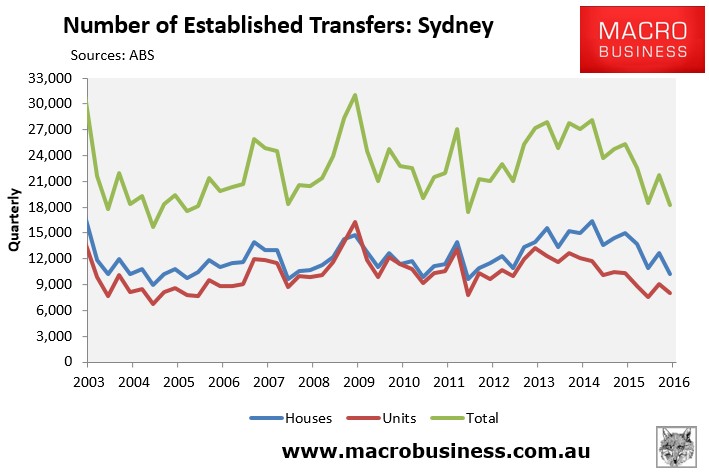
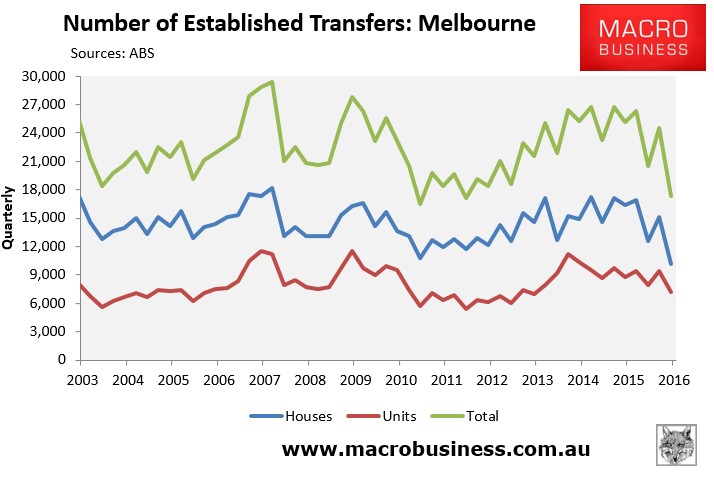
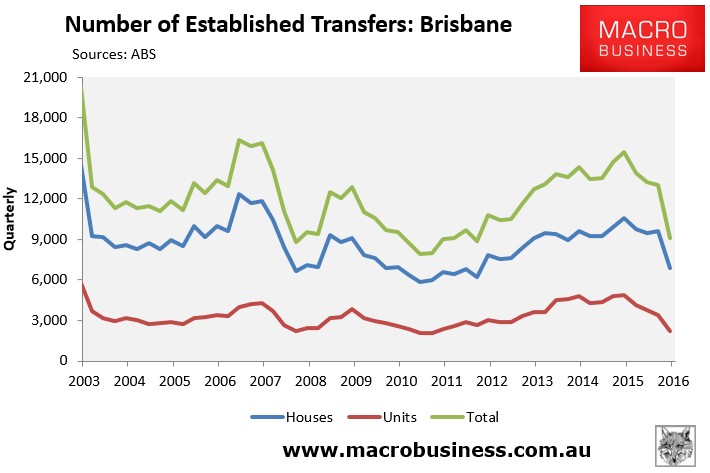
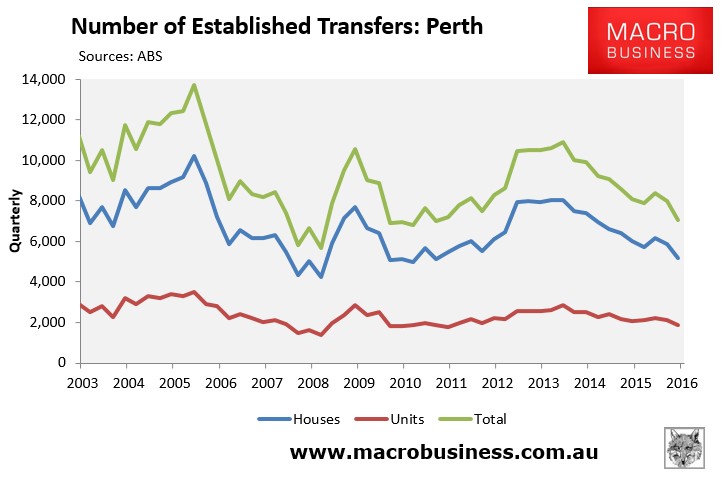
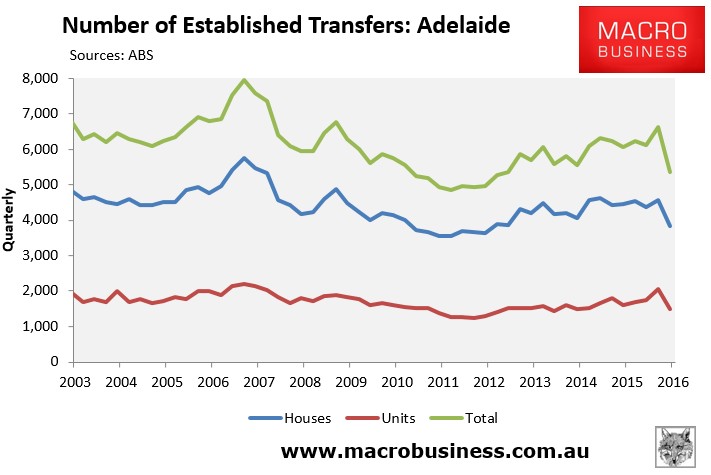
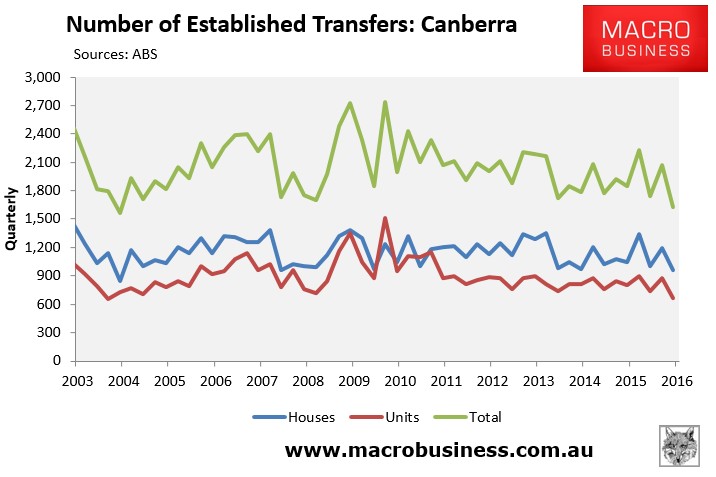
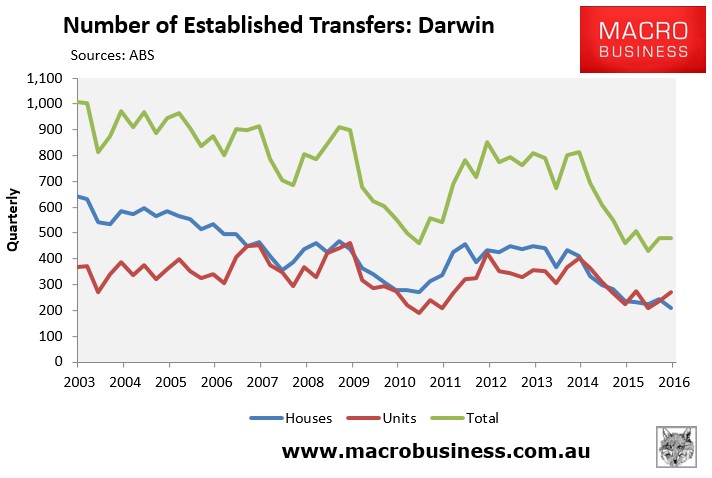
As shown above, transfer volumes have fallen everywhere over recent quarters.
Next, the below charts present the same data, but this time on a rolling annual basis:

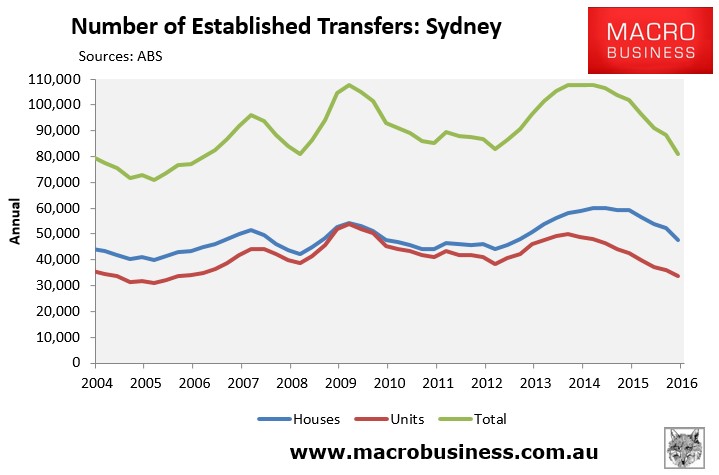
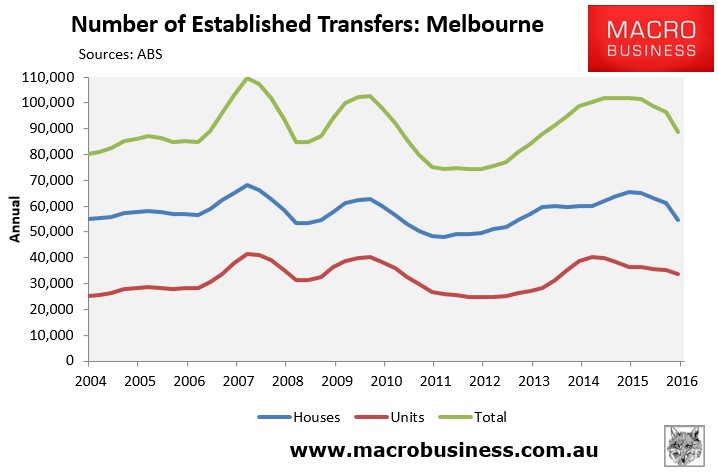
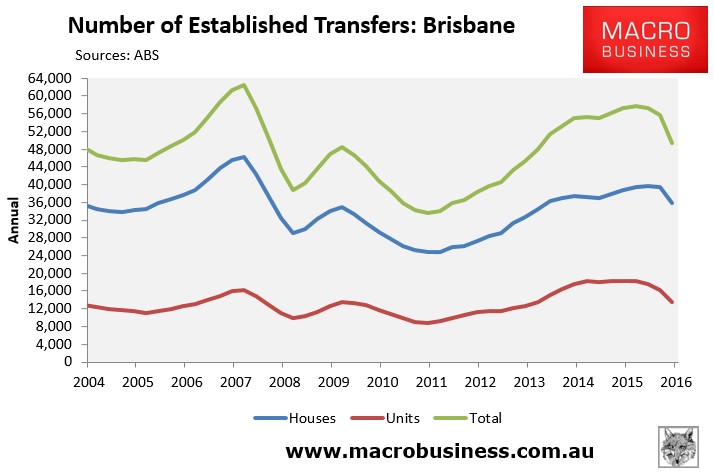
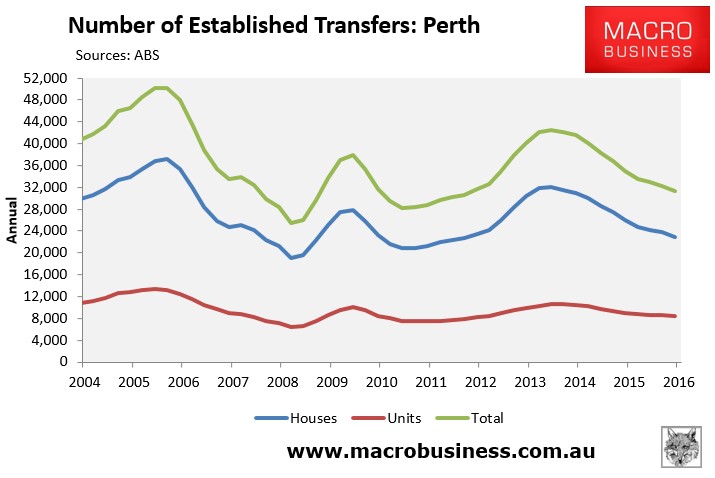

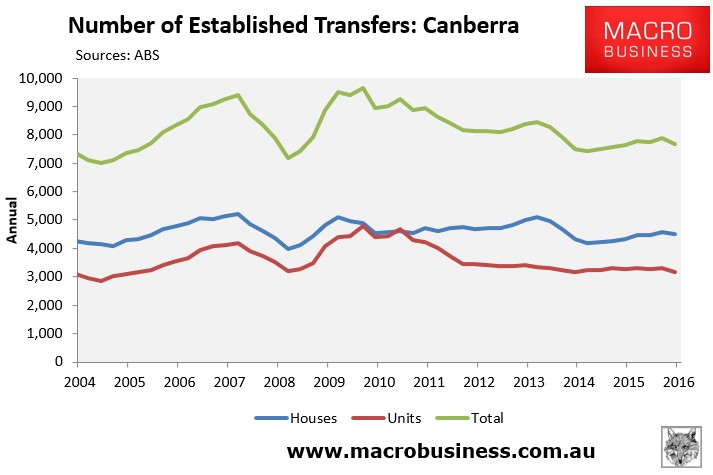
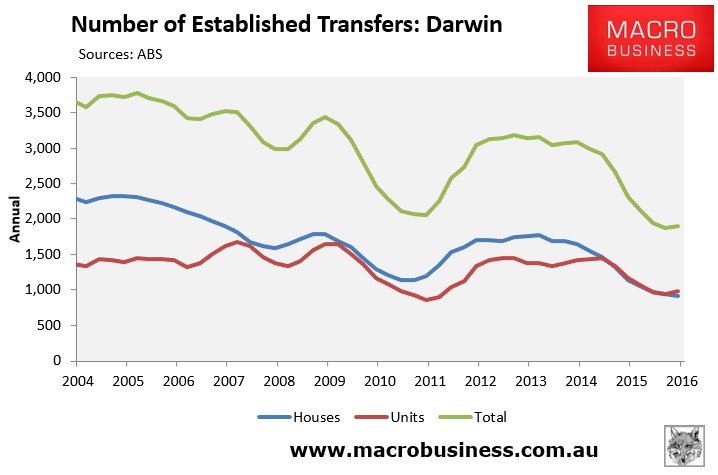
It’s much the same story, although the downturn in volumes appears less severe since it has only occurred over the past few quarters.
The tentative conclusion here is that falling transaction volumes do appear to have offset falling finance commitments, thus keeping prices elevated.
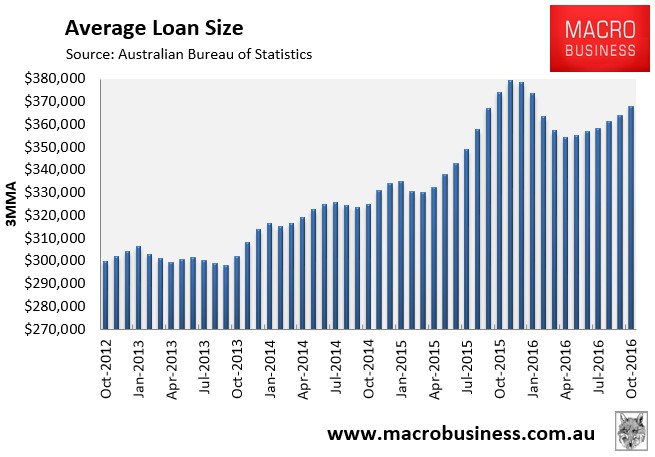
That said, average loan sizes have fallen over the past year – down 1.7% in the year to October – although they have clearly rebounded over recent months:
Nevertheless, changes in transfer volumes have historically been a good leading indicator of prices, at least for the major capitals:
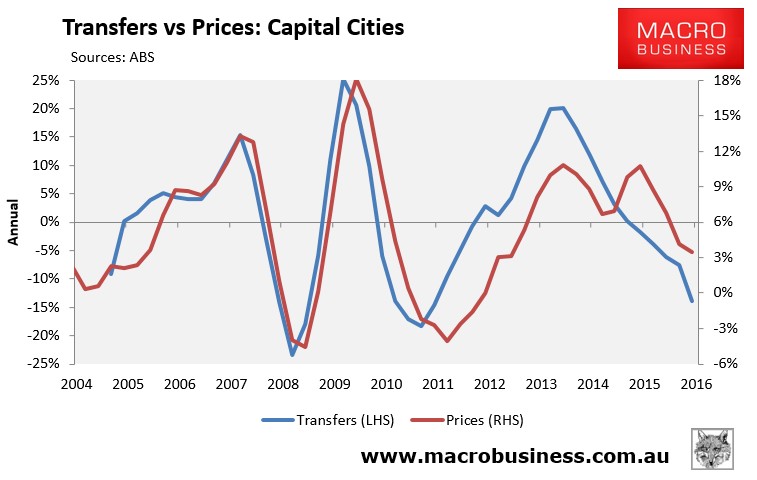
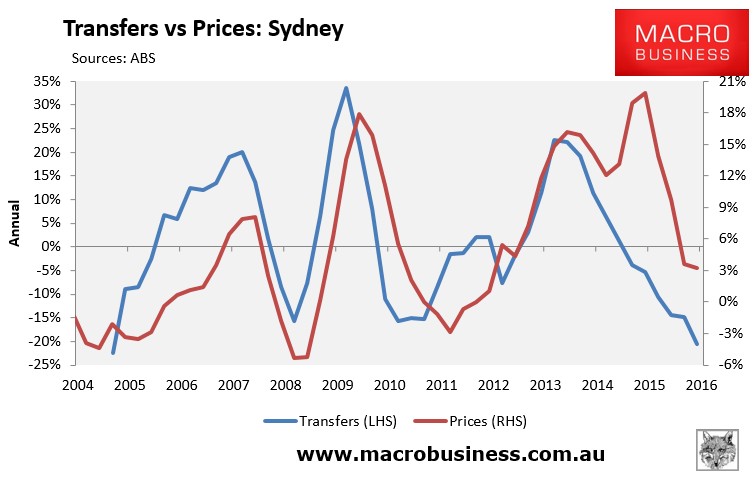
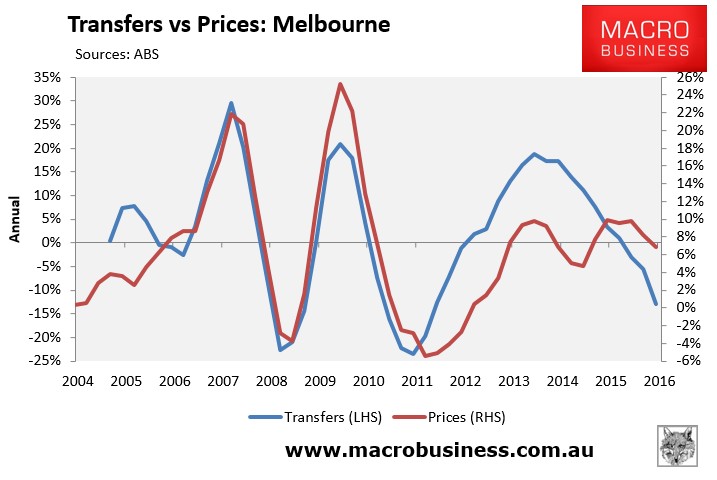
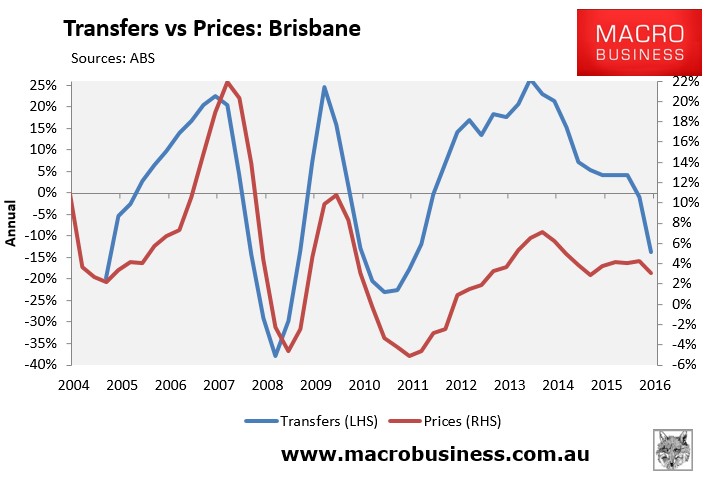
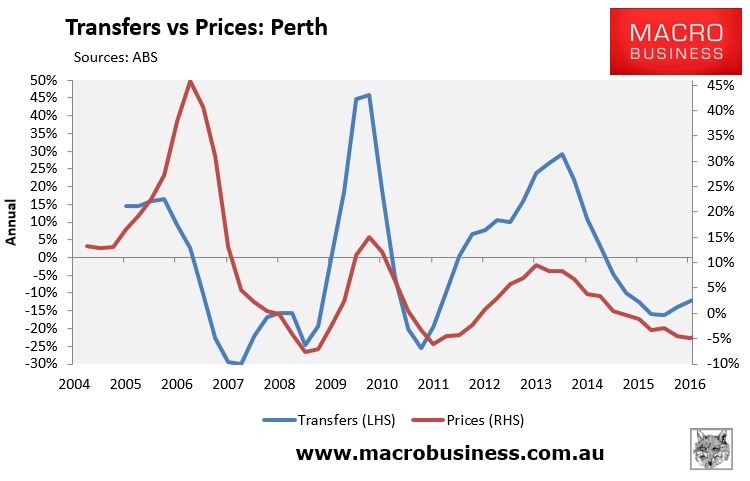
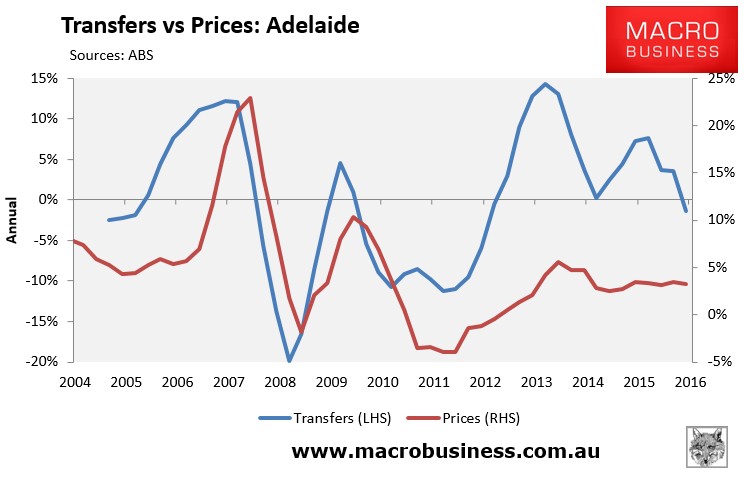
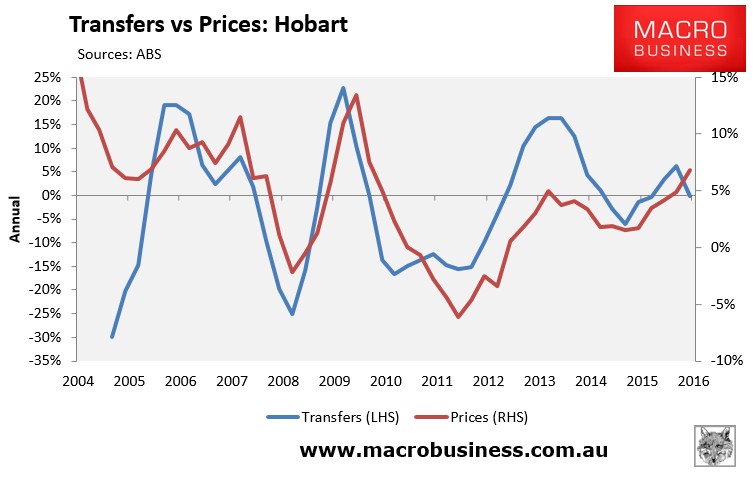
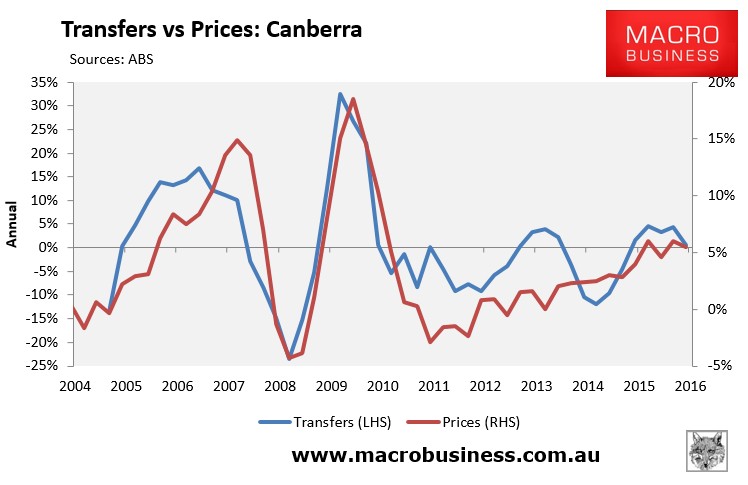
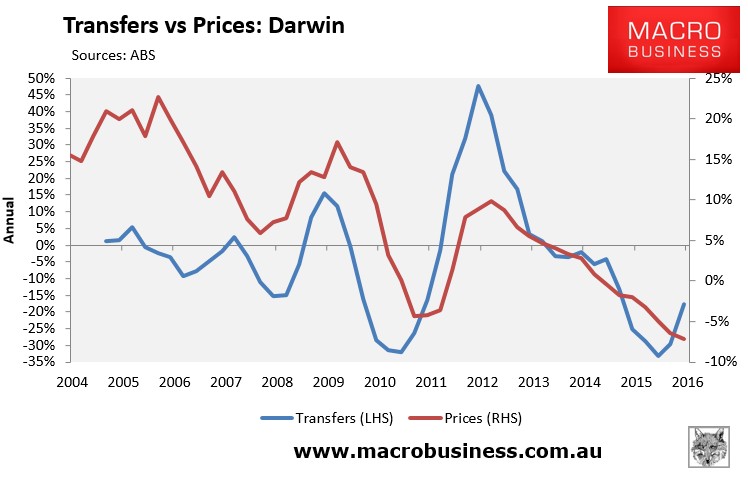
Thus, they are indicating falling price growth.
