
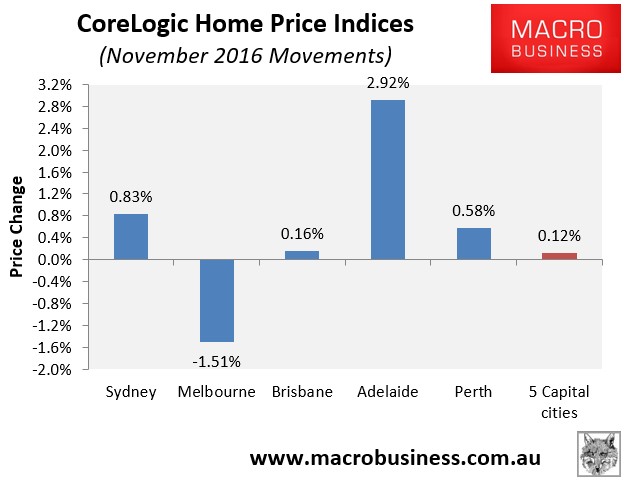
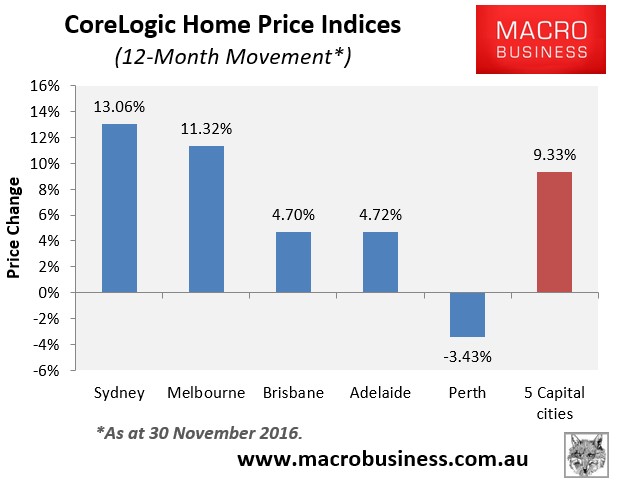
CoreLogic’s dwelling price results are in for November, with a 0.12% rise in values recorded over the month at the 5-city level (see next chart).
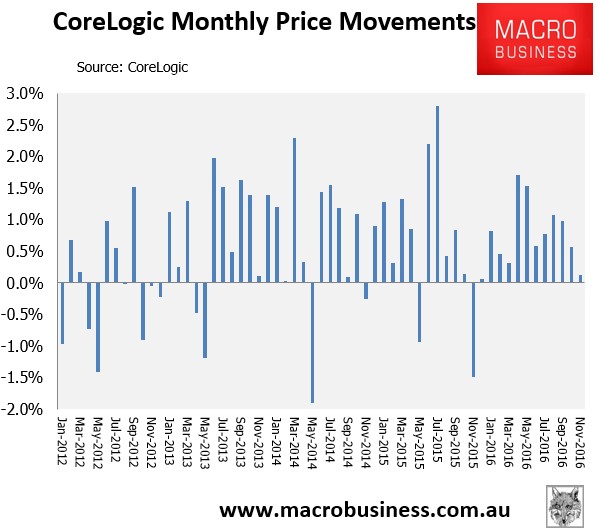
It was the 12th monthly rise in home values in a row (see next chart).
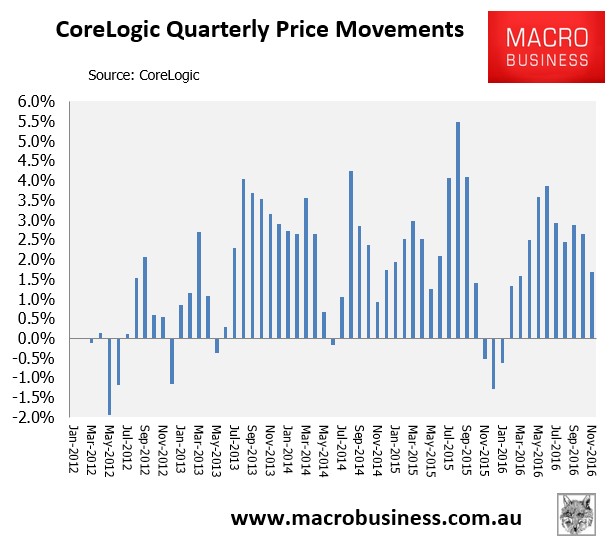
Over the quarter, price growth fell back to 1.67% at the 5-city level, down from the 2.65% recorded in October (see next chart).
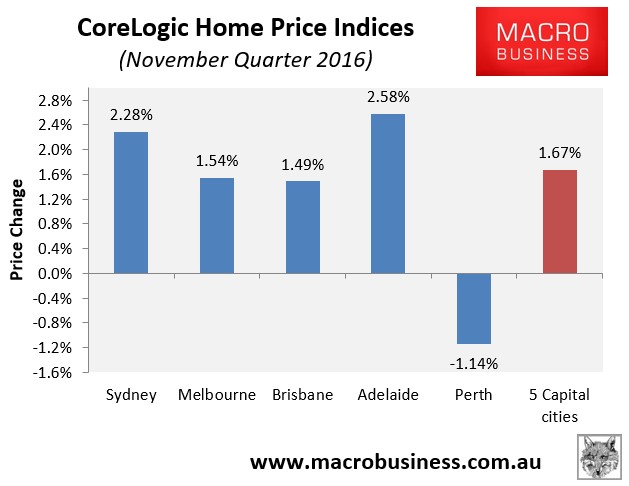
Over the quarter, prices rose strongest in Adelaide and Sydney, but fell in Perth (see next chart).
The next chart, which tracks trend annual price growth, shows a strong rebound driven in part by the 1.5% fall in values recorded nationally in November 2015 (see next chart).
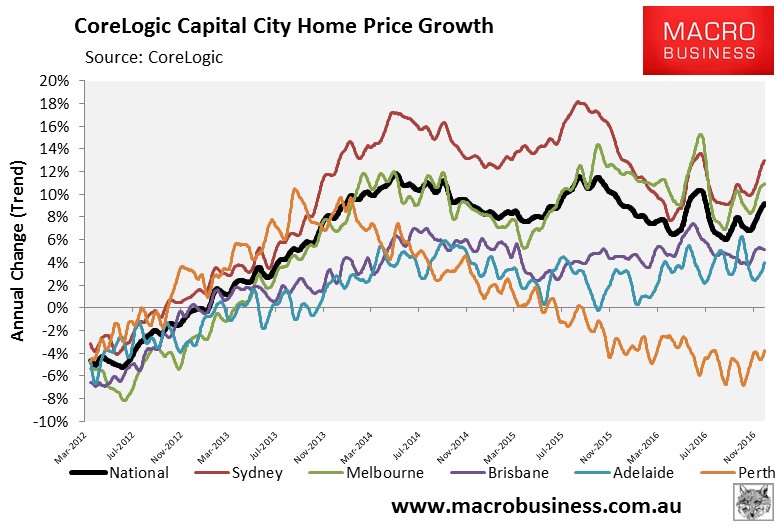
Sydney remains the strongest housing market in Australia when measured in annual growth terms, edging out Melbourne (see next chart).
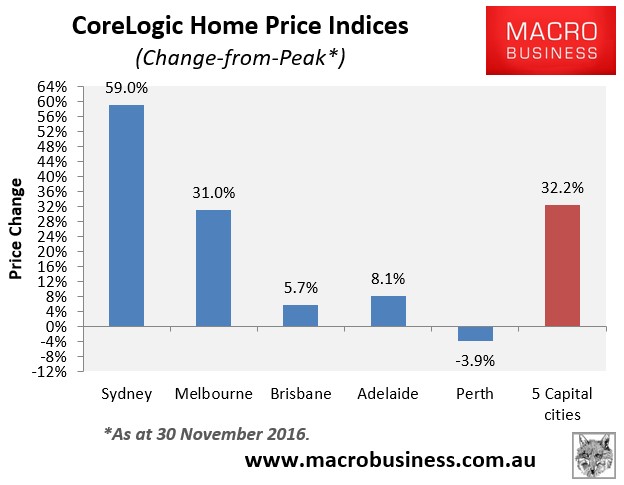
And values are now 32.2% above the October 2010 peak at the 5-city level, driven almost entirely by massive growth in Sydney (+59.0%) and to a lesser extent Melbourne (+31.0%), with the other major capitals not doing a lot (down in real inflation-adjusted terms):
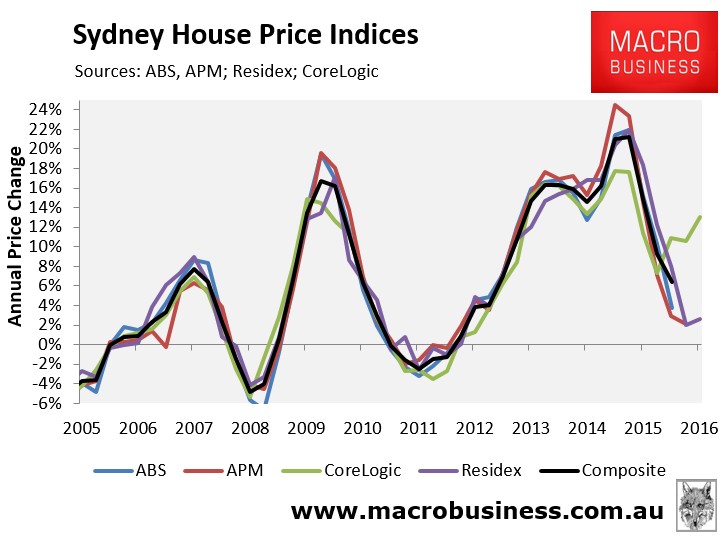
CoreLogic’s results continue to decouple from the other data providers:
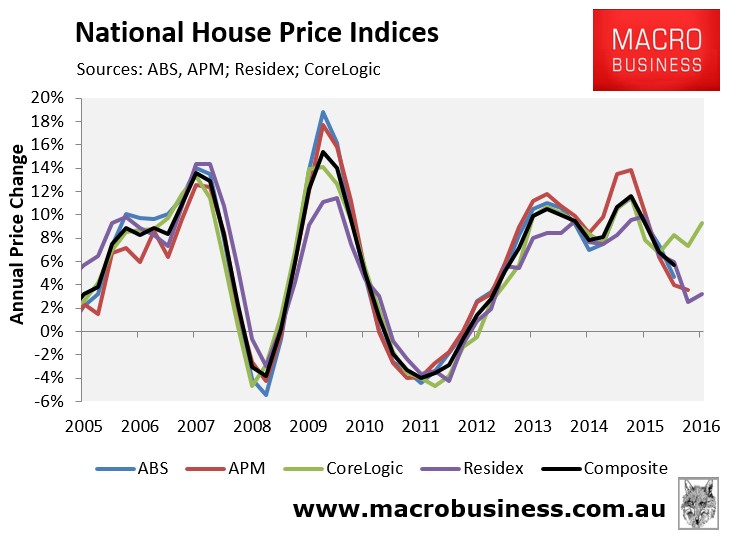
Especially with regards to Sydney:
Thus, question marks remain over this index.
