
One charts says it all, from Macquarie:
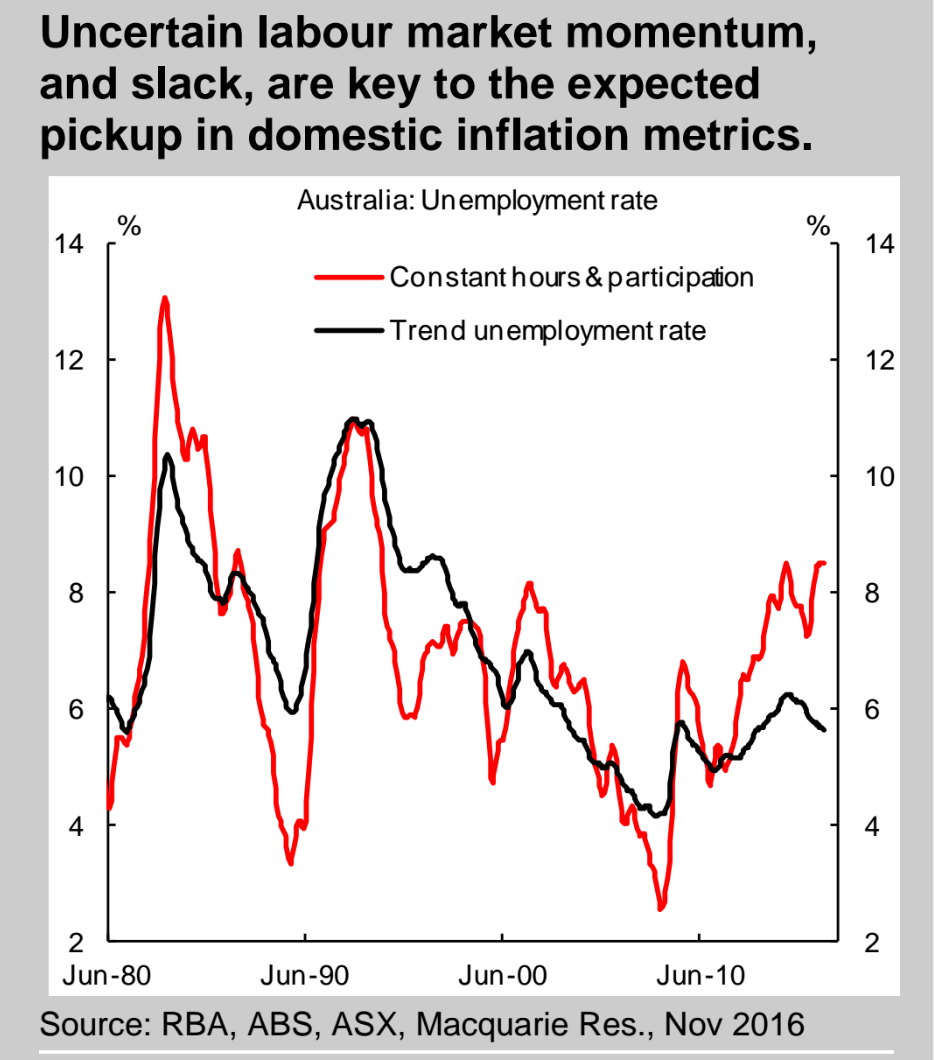
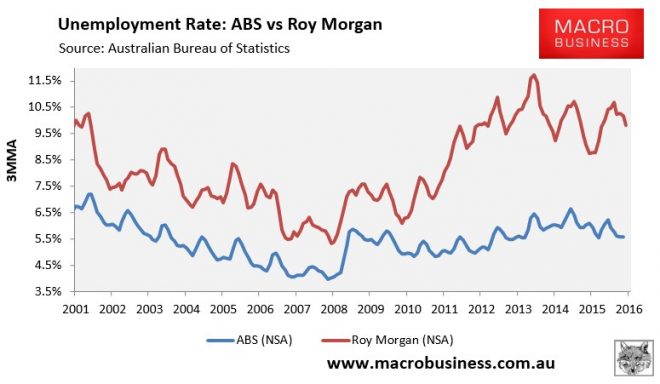
Taking constant hours and participation it’s 1993 and getting worse! No wonder the Roy Morgan un-adjusted unemployment is so much worse:
One charts says it all, from Macquarie:
Taking constant hours and participation it’s 1993 and getting worse! No wonder the Roy Morgan un-adjusted unemployment is so much worse:
