From Westpac’s Matthew Hassan:
- Australia is in the midst of a major boom in high rise apartment construction with around 115k dwellings current being built. Risks around this building cycle have become critical to the outlook for both residential investment and conditions across residential property markets more widely. This article looks at how this boom is likely to unfold in terms of the project pipeline, residential building activity and completions.
- The much longer time frame on high rise projects means further rises in the high rise pipeline and growth in residential investment are essentially locked in for 2016 and 2017. Any sharp drop off in approvals will only impact from 2018 on. Completions have entered a sustained rise and will remain elevated at around 55-65k a year through to late 2018 even if approvals correct sharply lower.
- Despite the starting point of a large accumulated shortage of housing, the surge in supply in 2017-18 may be difficult to absorb, particularly if it comes through quickly or if there are mismatches in supply and demand.
In recent reports we have discussed some of the issues surrounding Australia’s ‘high-rise’ apartment market, noting the large ramp-up in construction in recent years but focussing more on the risks around changing conditions for developers and foreign buyers. This bulletin takes a closer look at the physical supply coming through, when it’s likely to arrive, how this is likely to shape the residential construction cycle and how it may affect the supply-demand balance in the broader housing market.
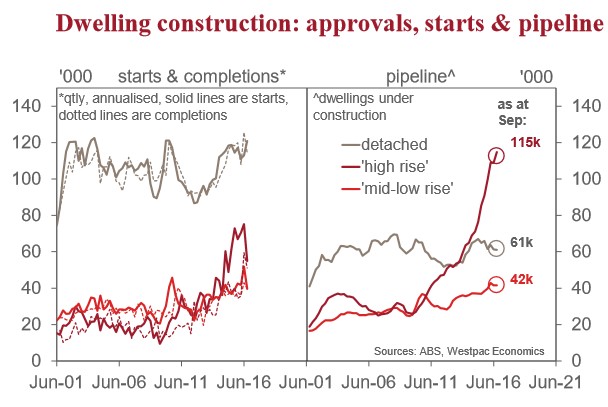
Projecting the high rise pipeline and completions Figures to June show 109k high rise apartments ‘under construction’ with a further 23k approved but yet to commence. With approvals in July-August running at a 21k quarterly pace the pipeline has likely lifted further to around 115k as at September. Note that through this analysis, ‘high rise’ refers to the ABS classification of dwellings in a block with four or more storeys.
A key point to note about this pipeline is that high rise projects typically take much longer to run from approval to completion, reflecting the scale and complexity of the construction involved. We can exploit this aspect to get a better sense of how work done and completions is likely to track under different assumptions about the flow of new approvals.
Our statistical analysis of approvals, starts and completions confirms the longer lags for high rise activity. The chart below shows indicative completion times for different dwelling types. Whereas the average detached house takes 6mths to complete and the average mid-low rise dwelling takes 10mths, the average high rise dwelling takes the best part of two years.
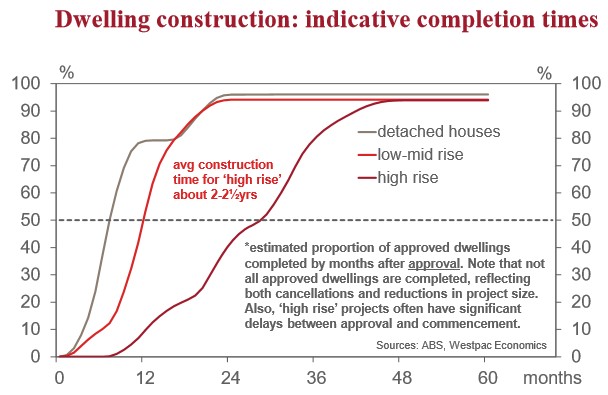
Add in a tendency for longer lags between approval and commencement and we find a substantial portion (nearly 40%) of high rise dwellings take over 2½ years from ‘go to woah’.
These estimates are broadly confirmed by a recent ABS article looking at average completion times for individual projects. The research also noted that completion times vary significantly year to year and for units have been rising over the last few years, especially in NSW, no doubt reflecting the higher concentration of large high rise projects.
Using our profile of the distribution of completion times we can flesh the forward view out a bit more by running projections based on a range of assumptions about the flow of new approvals. Industry reports suggest there is a large number of high rise projects at the earlier ‘pre-approval’ stages of development. Hence while recent changes affecting developers and investors highlight risks to the downside there is also a plausible case for activity to remain strong near term.
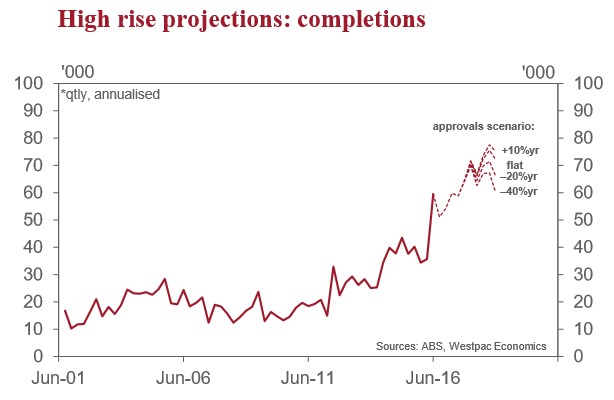
As such our projections draw on a range of scenarios for new approvals running from high (+10%yr), to flat, a significant correction (–20%yr) and a more extreme correction (–40%yr).
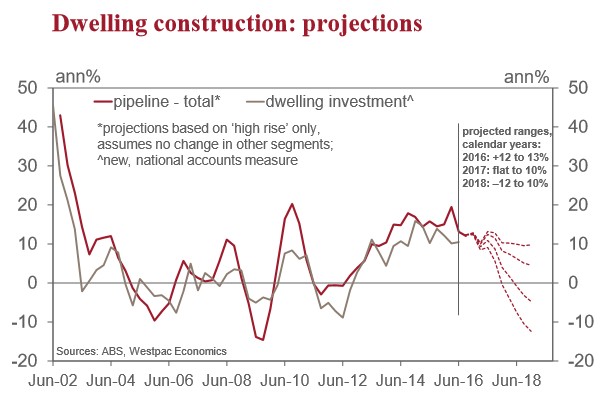
The resulting projections are shown in the charts opposite. The first chart shows the scenarios for approvals and the projected path for total high rise dwellings under construction. The second chart how this translates into growth in the broader dwelling construction pipeline (assuming no change in other segments) and the relationship between this and the national accounts measure of new dwelling investment. The third chart shows the projected number of completions. All projections run out to December 2018.
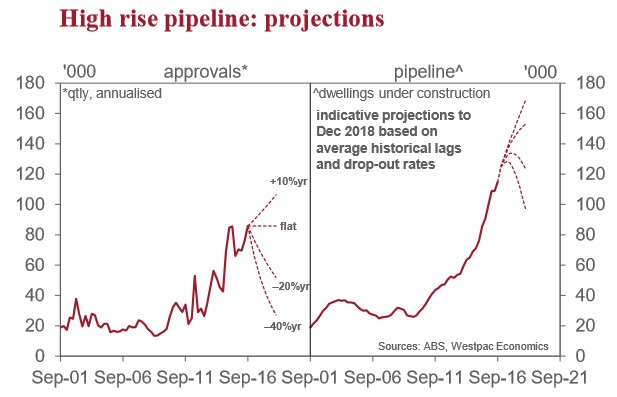
The main takeout is that the long lags on high rise projects mean solid growth is essentially locked in for 2016 with the pipeline on track to hit 125k by year end largely irrespective of near term path of new approvals.
All scenarios see growth moderate in 2017 but the ‘extreme correction’ is the only one to result in an outright contraction and even then it is only a slight dip. The ‘significant correction’ scenario sees the pipeline peak at 134k in September 2017 while the ‘extreme correction’ scenario peaks at 128k in June 2017.
The major impact on the pipeline from any downturn in high rise approvals instead comes from 2018 on – hardly a surprise given the aforementioned 2-2½yr lags. By ‘year 3’ of the projection the assumed path for approvals becomes the dominant driver of the pipeline.
Implications for dwelling investment
The second chart above shows how this dynamic essentially locks in growth for total dwelling investment. It shows annual growth in the total pipeline of dwelling projects – i.e. both high rise and non-high rise – alongside annual growth in new dwelling investment, the two series showing a fairly clear link.
Dotted lines show projected growth in the total pipeline based on the different approvals scenarios and assuming no change in the pipeline of ‘non high rise’ activity. While this assumption is made to allow us to project forward, the profile of flat ‘non high rise’ approvals is not so far fetched given how stable both detached house and ‘mid-low’ rise approvals have ben in recent quarters and the likely support coming from recent interest rate cuts.
The bottom line is that the total pipeline is likely to finish 2016 up 12-13%yr with growth under ‘correction’ scenarios slowing to 0-4% in calendar 2017. Again, the assumed path for high rise approvals only starts to dominate from 2018 with the two ‘correction’ scenarios ranging from –4.7%yr to –12.4%yr.
The main takeaway is that new dwelling investment is unlikely to contract in 2017, especially if non high rise approvals hold up. Also, if high rise approvals start to drop off sharply, the impact on construction activity will come through in 2018 rather than 2017.
Implications for completions
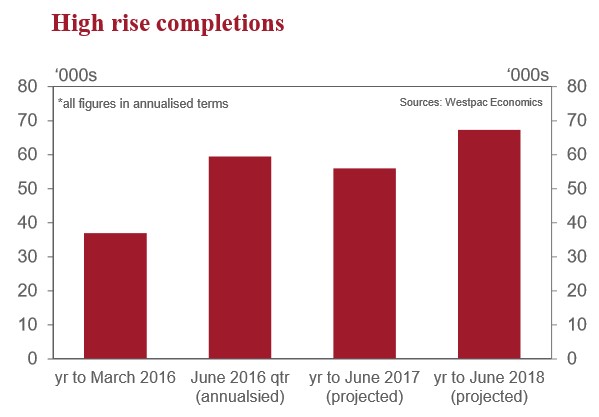
The implied projection for completions is also notable. The third chart above shows how the various scenarios for high rise play through to completions. The clear point here is that the kick up in completions reported for the June quarter marks the start of a multi-year wave of higher completions.
Completions totaled 37k in the year to March but jumped in June to track a 60k annual pace. All scenarios have completions tracking a 56k annual pace over the next four quarters (to June 2017) with a step up to a 67k pace over the following four quarters that carries through to the end of 2018.
The ‘correction’ scenarios only see clear downtrends in completions come through from 2019.
Potential impacts of supply surge
Turning to how this new supply might impact the wider market, the starting point here is to acknowledge the large structural deficit that has accumulated over the previous decade. The combination of a sustained migration-driven surge in population growth and persistently low levels of building through most of this period has led to an accumulated shortfall of around 220k dwellings.
This ‘pent-up’ demand is best thought of as people who would otherwise have formed a separate household by now choosing to instead remain in an existing household – by far the largest group being older-aged children still living in the family home.
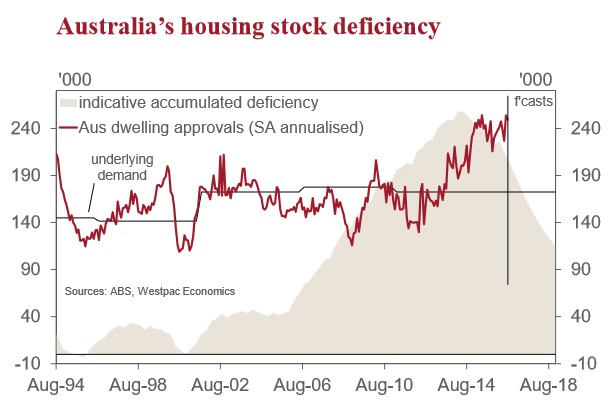
The current construction boom is starting to redress this shortfall but the scale of the deficit means the pace of rebalancing is slow – with population driven demand continuing to rise at about 170k a year even the current, unprecedented, boom is still only closing the gap by around 50k a year. It took about a decade for the shortage to accumulate and even under current boom conditions it will take a long time for the deficiency to be redressed.
As such, the prospect of a market-wide oversupply looks remote. However, this structural supply-demand imbalance is a ‘medium term’ and market-wide concept – it does not preclude pockets of oversupply emerging either for short periods (as large additions to the dwelling stock take time to be absorbed) or due to a mismatch between supply and demand (e.g. too many of the ‘wrong’ type of dwellings in the ‘wrong’ locations). Both of these look likely to be issues in the apartment segment. Note that new building can meet ‘pent up’ demand both directly (providing dwellings for those seeking to form a new household) and indirectly as occupants moving into the new dwelling free up housing elsewhere (both owner occupier and rental).
So far, rental vacancy rates remain low. However, as discussed, the wave of new supply is only just starting to come through.
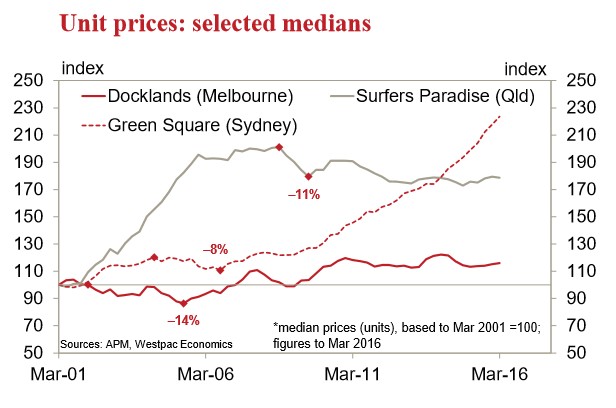
History provides some limited guidance. Previous high rise building booms have generated localised oversupply problems in both Sydney (in the inner south in 2004-06) and Melbourne (in the Docklands precinct in 2002-05). The former proved to be a relatively minor issue with supply absorbed reasonably quickly. The latter appeared to be a more severe with a longer lasting oversupply. Note that in both cases impacts on the wider rental market were limited (city-wide vacancy rates actually declined).
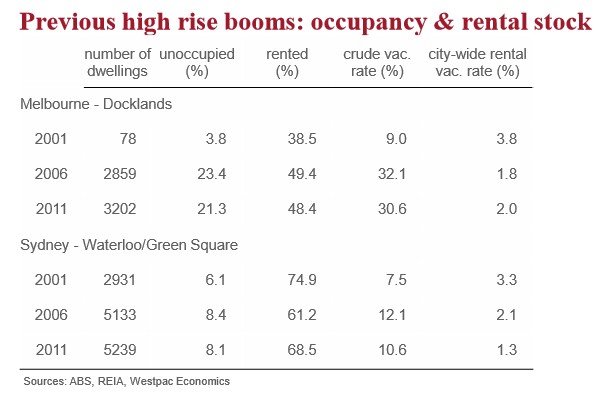
Taking projected apartment completions over the next 2yrs and using Census data covering the total rental stock and the localised overhang during these two previous episodes we can work up some rough ‘ball park’ estimates of the potential impact on city-wide rental vacancy rates. In effect these are ‘what if’ estimates assuming no change in rental stock levels and vacancy rates elsewhere and assuming that new apartment supply is absorbed at the same rate as during these two previous episodes.
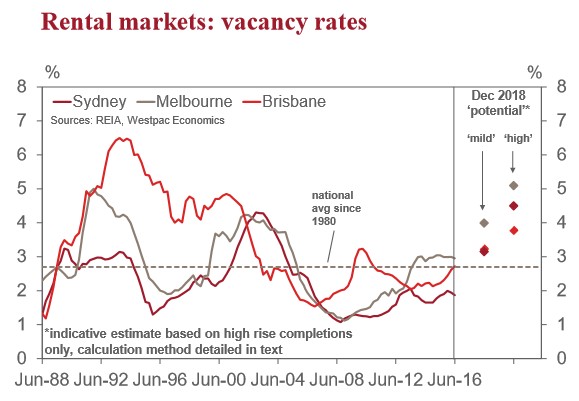
The resulting estimates suggest city wide rental vacancy rates could rise 1-1½ppts in Sydney and Melbourne under a ‘moderate’ absorption problem (the experience in Sydney’s inner south) and by 2-2½ppts under a more ‘difficult’ scenario (based on the experience in Melbourne’s Docklands).
These are very crude estimates though. Gauging the extent of any potential oversupply problems is very difficult and depends not only on the pace of new supply but on a wide variety of factors affecting whether dwellings are made available and how well they meet ‘pent-up’ demand.