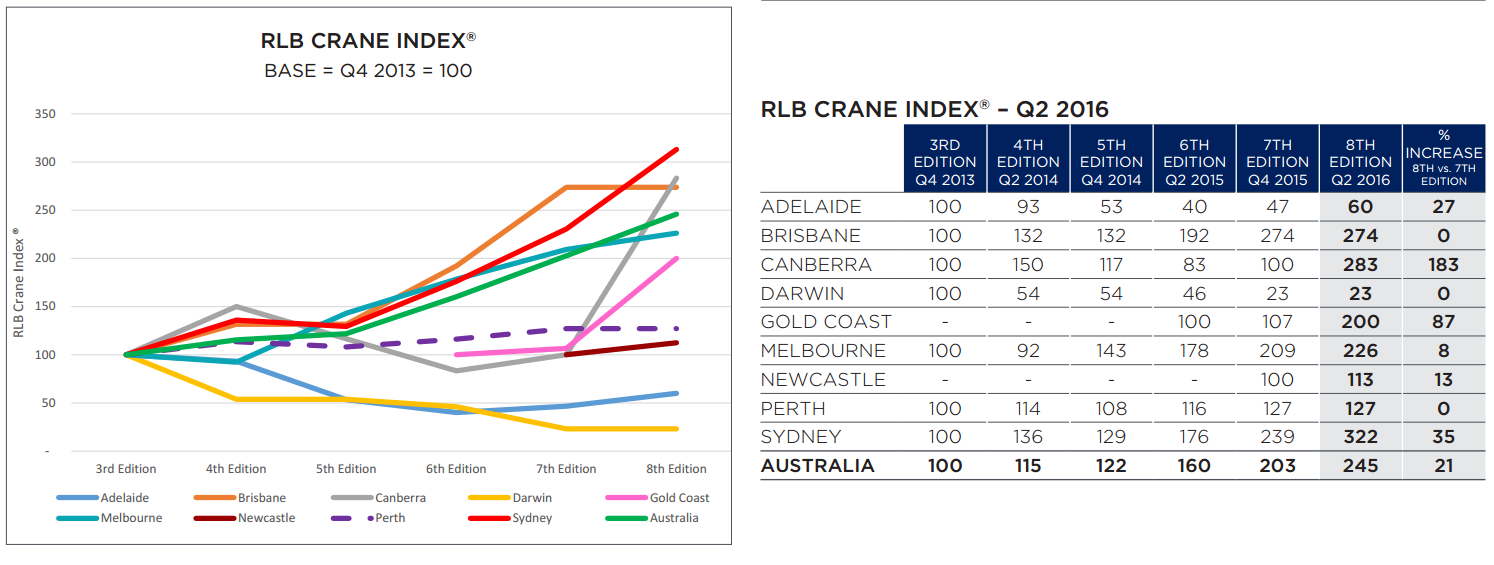
Australia’s crane activity of 647 cranes was represented by significant growth in Sydney, Canberra, Gold Coast and Melbourne. This represents a 20% increase since our last Crane Index. The churn rate of cranes since the previous count was 80%, i.e. 80% of all cranes counted in the previous Crane Index were removed and erected on other sites around Australia. This churn rate highlights very strong levels of activity over the short term. The increase of an additional 113 cranes since our last count was mainly centred in Sydney with 76, Gold Coast 14, Melbourne 12 and Canberra 11. Perth was the only city to show a fall in crane activity, albeit by a small number.
Sector activity within Australia is still dominated by the residential sector, accounting for 81% of all cranes recorded, representing 525 cranes. Since RLB’s last Crane Index, some 264 cranes were removed from residential projects around the country, and 368 erected. This again highlights the current strength of the multi storey residential sector. The net difference of 107 cranes being added to the sector is a positive sign for the industry at large. No other sector has more than 10% of cranes erected within Australia, highlighting once again the strength of the residential market.
Commercial developments within Australia have 45 cranes or 7% erected. The next largest sector is Civic which is dominated by the development of the Sydney International Convention Centre which is Australia’s largest current development with nine cranes. Construction work done in Australia in the non engineering based sectors increased 9.7% from 2014 results. Residential construction rose 11.6% while non residential work done increased 0.2%. The diminishing gap between engineering work done and building works is highlighted in 2015 where the ratio between engineering work done and building work done was $97b : $101b (96%), whereas in 2014 and 2011 the work done ratios were $91b : $116b (78%) and $86b : $106b (86%) respectively. These results highlight the growing importance of the non-engineering construction sector. Q2 2016 Eighth Edition
Construction work done in Australia in the non engineering based sectors increased 9.7% from 2014 results. Residential construction rose 11.6% while non residential work done increased 0.2%. The diminishing gap between engineering work done and building works is highlighted in 2015 where the ratio between engineering work done and building work done was $97b : $101b (96%), whereas in 2014 and 2011 the work done ratios were $91b : $116b (78%) and $86b : $106b.
David Llewellyn-Smith is Chief Strategist at the MB Fund and MB Super. David is the founding publisher and editor of MacroBusiness and was the founding publisher and global economy editor of The Diplomat, the Asia Pacific’s leading geo-politics and economics portal.
He is also a former gold trader and economic commentator at The Sydney Morning Herald, The Age, the ABC and Business Spectator. He is the co-author of The Great Crash of 2008 with Ross Garnaut and was the editor of the second Garnaut Climate Change Review.