
The Australian Bureau of Statistics (ABS) today released the national accounts for the June quarter, which registered a 0.5% increase in real GDP over the quarter and a 3.3% rise over the year, meeting economists’ expectations.
On a per capita basis, real GDP rose by 0.2% and was up by 2.0% over the year. But more importantly for living standards, real national disposable income (NDI) per capita rose by 0.2% over the quarter and by 1.0% over the year (after sharp upward revisions to previous quarters).
According to the ABS, seasonally adjusted GDP growth for the quarter was driven overwhelmingly by final consumption expenditure, which increased 0.8% over the quarter, thus contributing 0.6 percentage points to the growth in GDP.
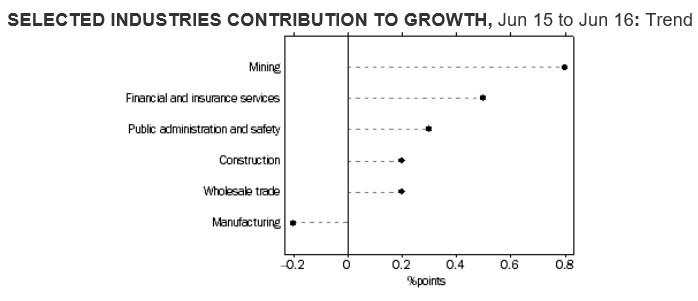
Over the year, GDP growth was driven by the old firm – houses and holes – with mining, financial services, and construction driving most of the growth:
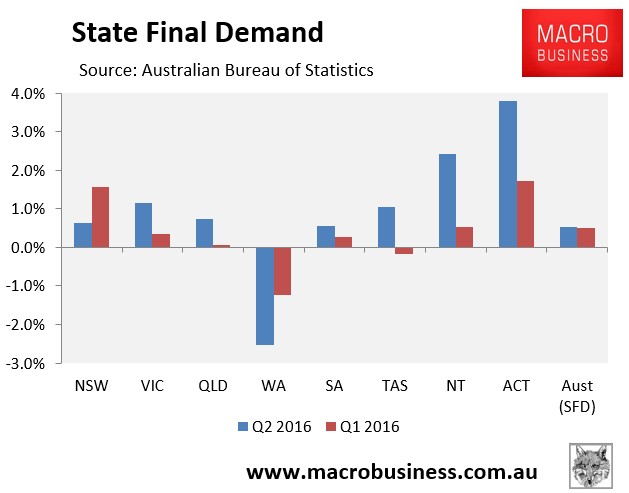
Quarterly final demand, which excludes export volumes, equaled GDP growth in the June quarter, also coming in at 0.5%. The picture was mixed, however, with big quarterly gains recorded in VIC (+1.1%), the territories (ACT +3.8% and NT +2.4%), and TAS (+1.0%), but a deteriorating situation emerging in WA (-2.5%):
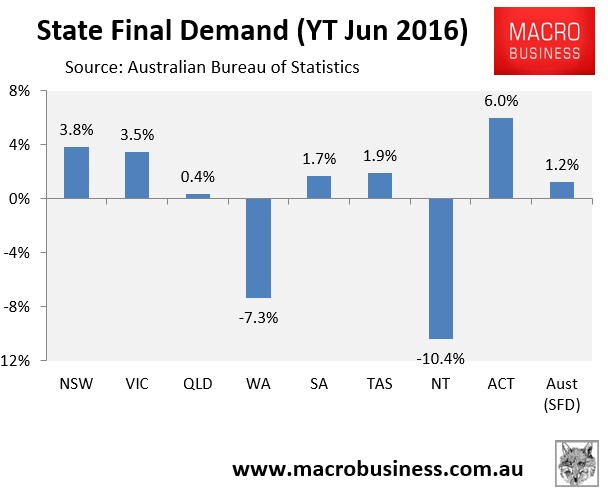
In the year to June 2016, final demand growth was weak (flat in per capita terms), growing by just 1.2% nationally. The bubble epicentres of NSW and VIC led the charge with help from the ACT, whereas QLD, WA and the NT dragged, with the latter two recording heavy falls:
The terms-of-trade rose by a seasonally-adjusted 2.4% over the quarter but fell by 0.5% in trend terms. Over the year it fell by 5.4% in seasonally adjusted terms and by 7.7% in trend terms:
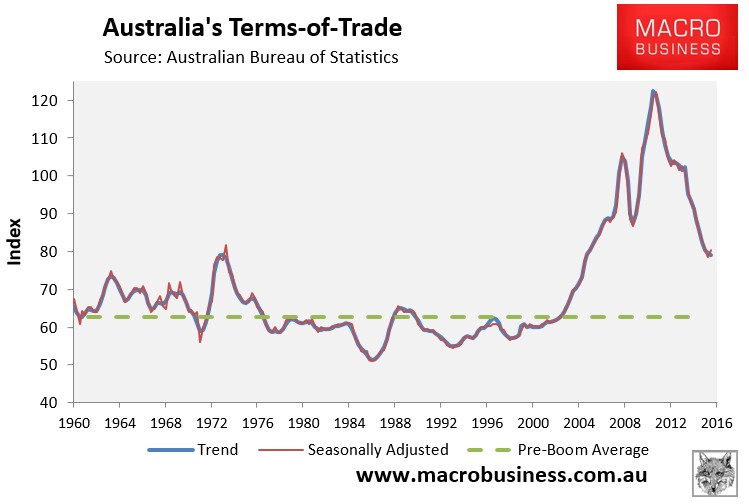
Strangely, the falling terms-of-trade did not drag on national income growth, with real national disposable income (NDI) rising by 2.3% over the year following heavy upward revisions to prior quarters.
Even after population growth, per capita NDI rose by 0.2% over the quarter and by 1.0% over the year, again with the latter impacted by upward revisions to prior quarters (see next chart).
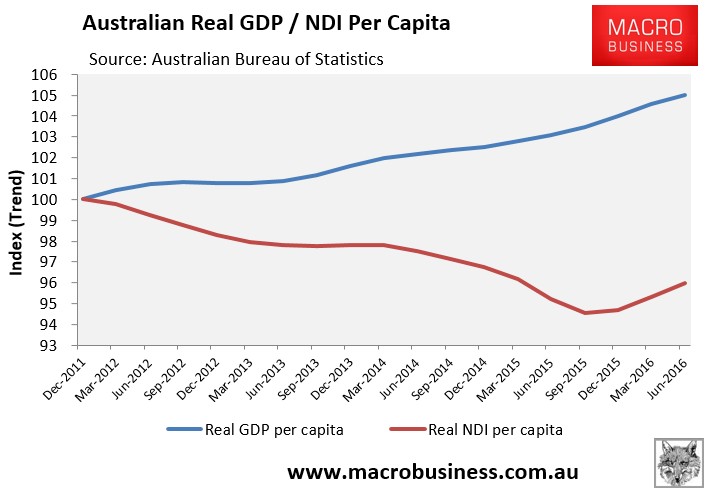
Still, since December 2011, per capita NDI has fallen by 4.0% versus 5.0% growth in real per capita GDP.
Moreover, NDI growth should remain weak as long as the terms-of-trade unwinds from its current still high level (see chart above).
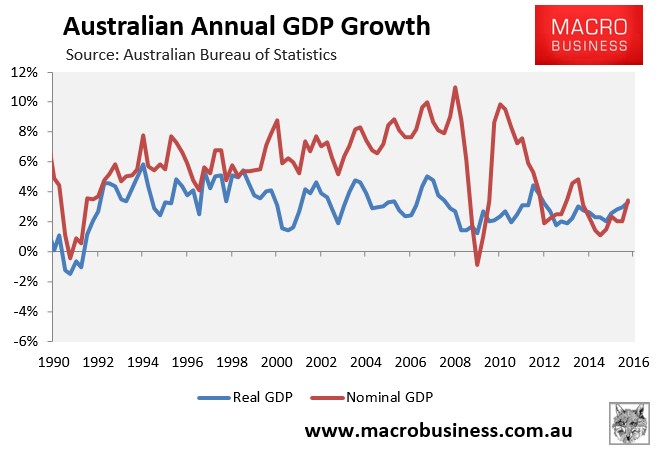
The latest rise in the terms-of-trade and NDI also helped nominal GDP to rebound, which rose by 1.3% over the quarter and by 3.4% over the year:
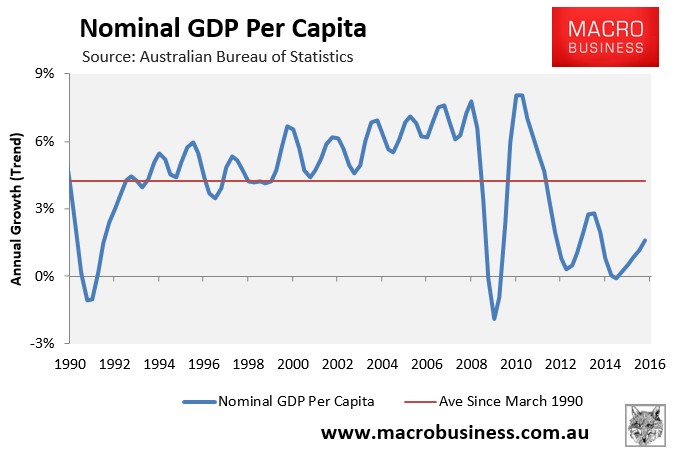
Nevertheless, the below chart shows how nominal GDP is still tracking well below the average since 1990, which is making things tough for Government finances:
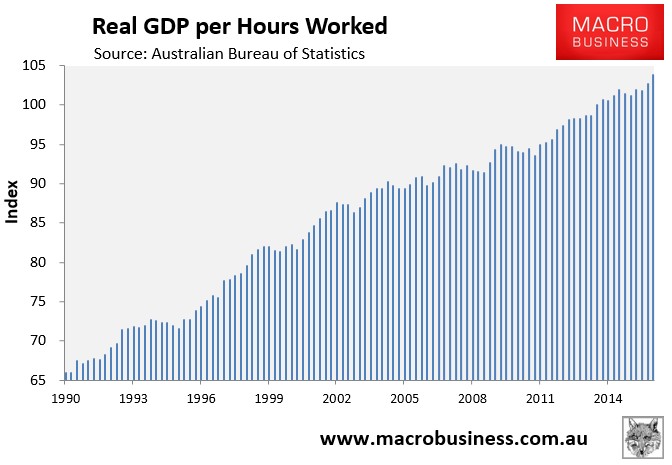
A big positive from this release is that real GDP per hour worked rose by 1.2% in the June quarter and was up by 2.7% over the year, suggesting improved labour productivity:
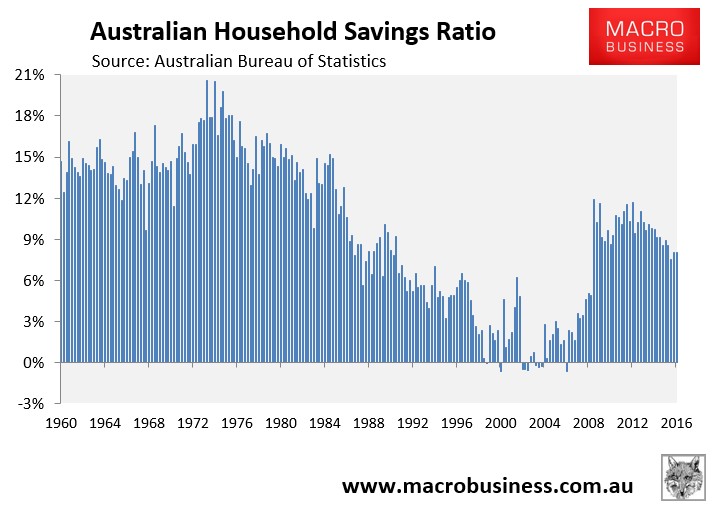
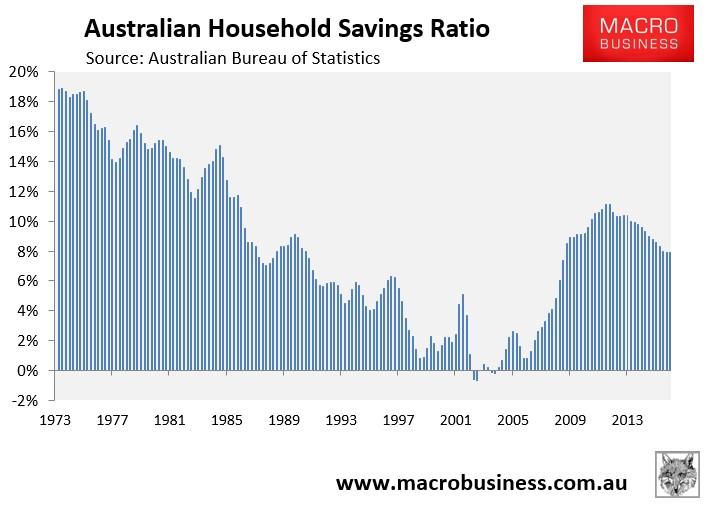
The household savings ratio also remained dead flat in both seasonally adjusted (8.0%) and trend (7.9%) terms:
In many ways, this is a strange release. While everyone expected headline GDP growth to come in above-trend, the revised lift in national disposable income since September 2015 is odd given the sharp (4.1%) trend decline in the terms-of-trade over that period.
These results are also at odds with domestic final demand, which registered just 1.2% real growth over the year (zero per capita growth), suggesting the economy outside of exports remains weak.
