
The resources boom was once the work-horse driving the Australian economy forward through the post-Global Financial Crisis period, helped in no small measure by the huge surge in mining-related capital expenditures (capex).
However, since late-2012, mining capex has been in free fall (see next chart), causing clear headwinds for the mining jurisdictions of Western Australia, Queensland and the Northern Territory.
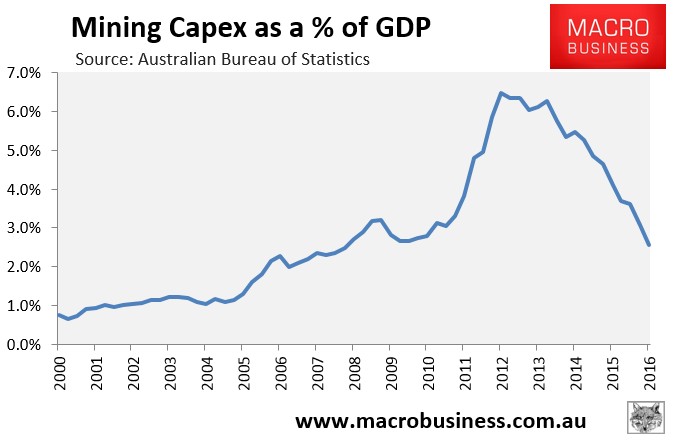
As shown above, mining capex as a percentage of GDP fell to 2.6% in the June quarter, down from a peak 6.5%. However, it still has further to fall before it returns to the pre-boom level of roughly 1% of GDP.
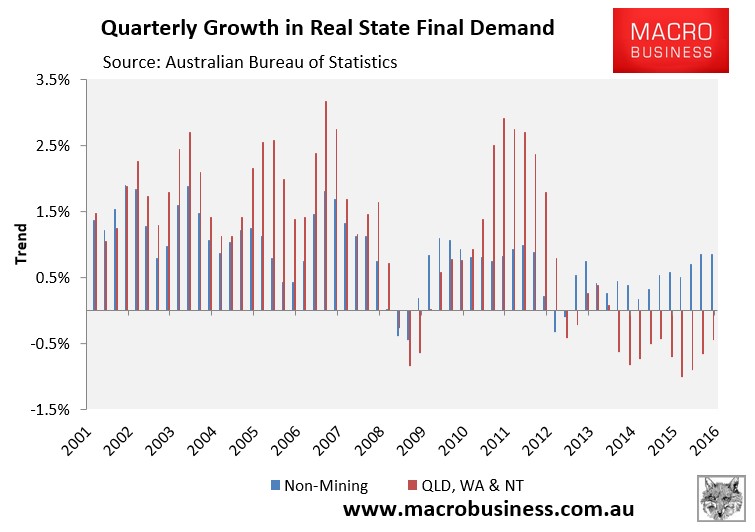
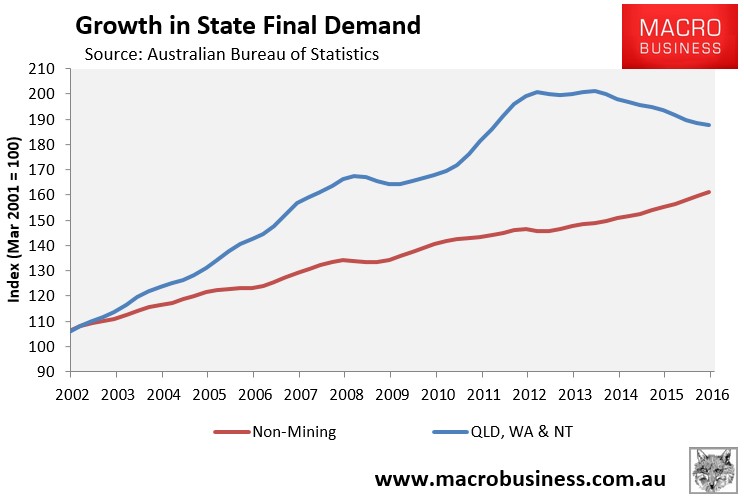
Wednesday’s national accounts release for the June quarter confirmed these trends, with state final demand (SFD) in the mining jurisdictions falling by a combined 0.5% in trend terms over the quarter, the tenth consecutive quarterly decline (see next chart).
Below are the charts for the individual mining jurisdictions.
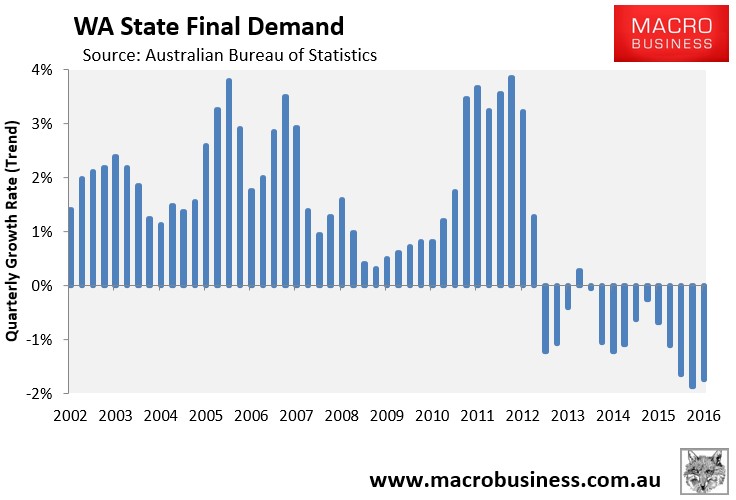
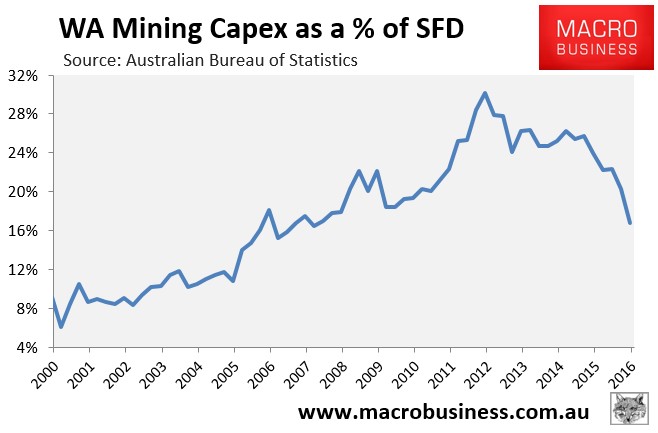
First, Western Australia where SFD has fallen for 10 consecutive quarters, although there was a slight improvement in the June Quarter:
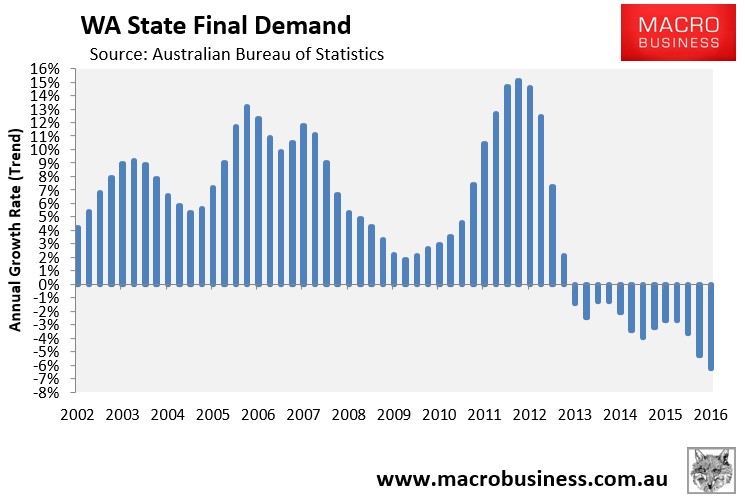
Annual growth in SFD continued to deteriorate, however, down 6.2% in the year to June:
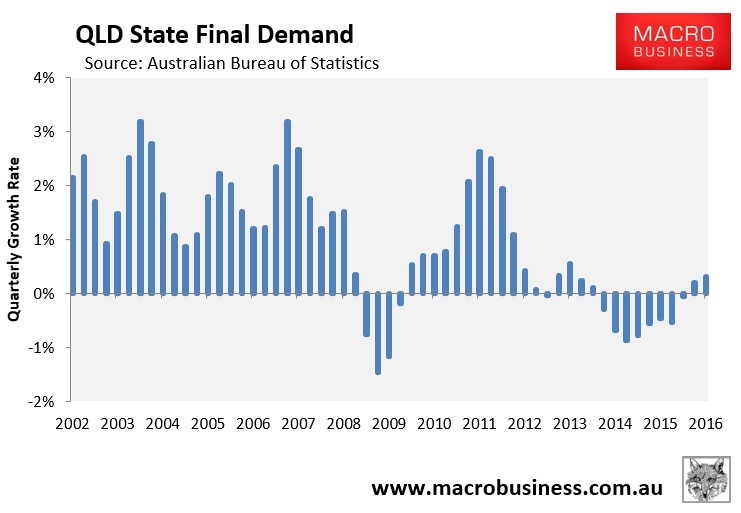
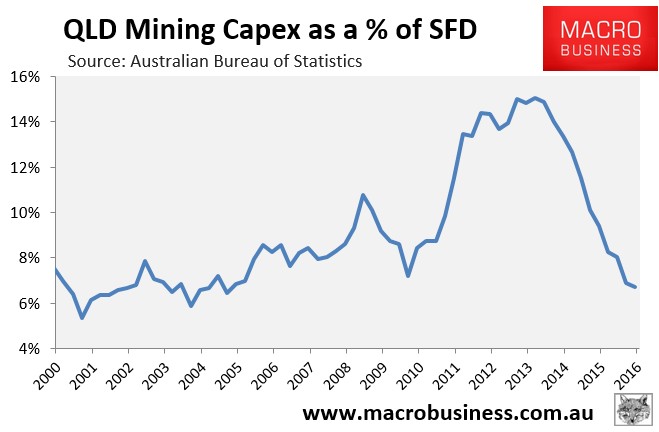
Next, Queenland where SFD has risen for two consecutive quarters after 8 consecutive quarters of falls:
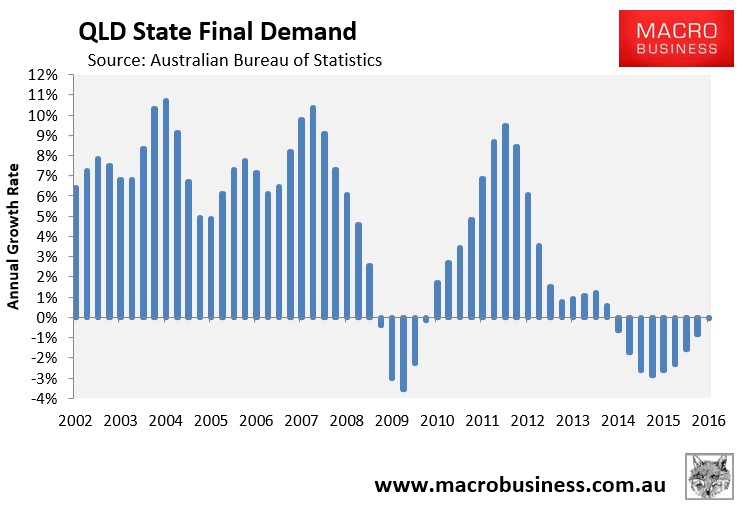
In annual growth terms, SFD was still negative in the year to June at 0.1%, but the picture is clearly improving:
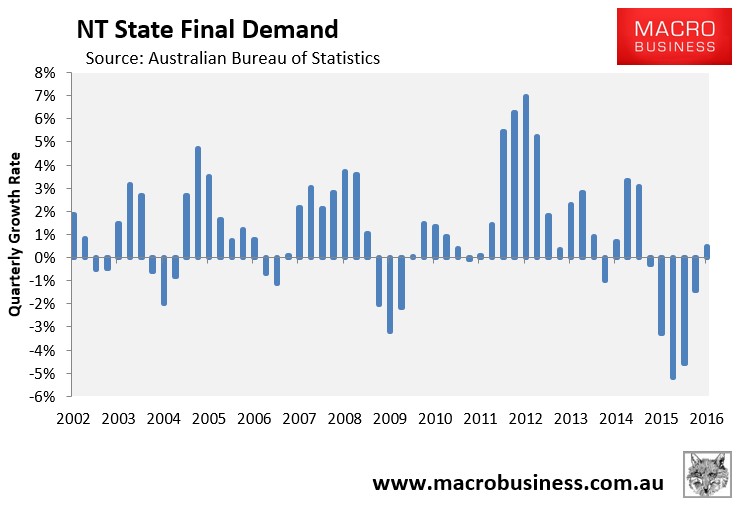
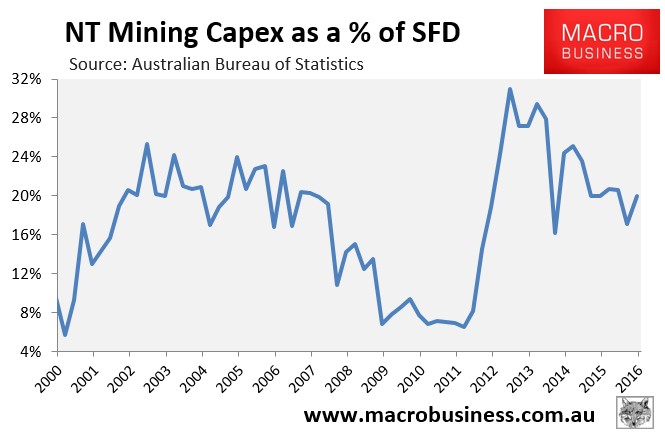
Finally, Northern Territory where SFD has finally risen after 5 consecutive quarters of falls:
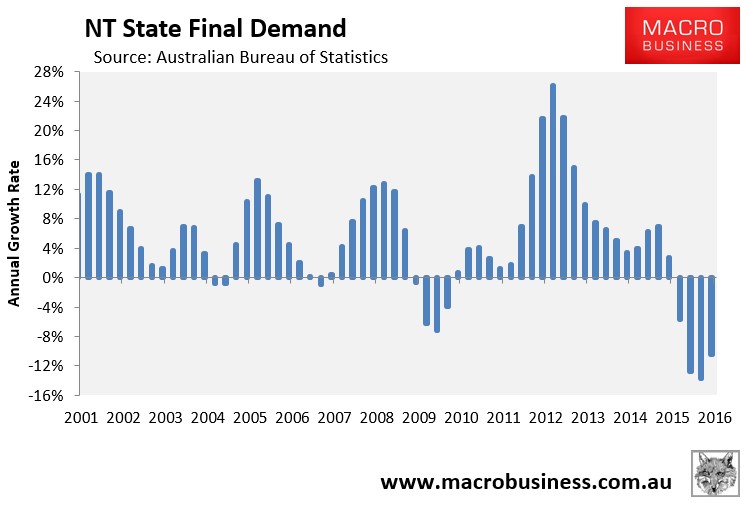
In annual growth terms, however, SFD was still deeply in the red, down by 10.4% in the year to June:
Indeed, the gap in SFD growth between the mining and non-mining jurisdictions continues to narrow (see next chart), although it has much further to run before it is closed – a process that will likely be complete once mining capex returns to historical norms of circa 1% of GDP as measured in the quarterly capex survey (see first chart) and the terms-of-trade reverts back to historical norms.
As shown in the below charts, which track capex against SFD, Queensland is almost through its adjustment, whereas Western Australia still has much further to go before its adjustment is over, as does the Northern Territory:
I should note that both Queensland and Perth are also facing a likely dwelling construction slump in the near future, given that construction has run well ahead of population growth (with more still in the pipeline for Queensland):
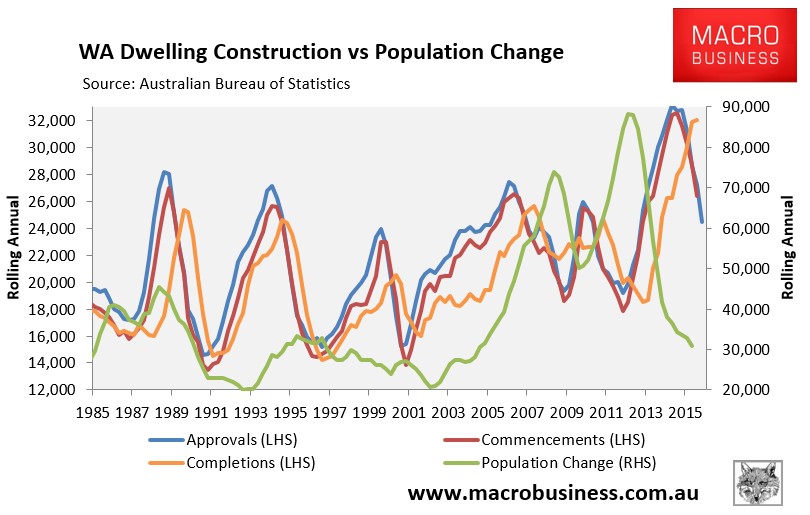
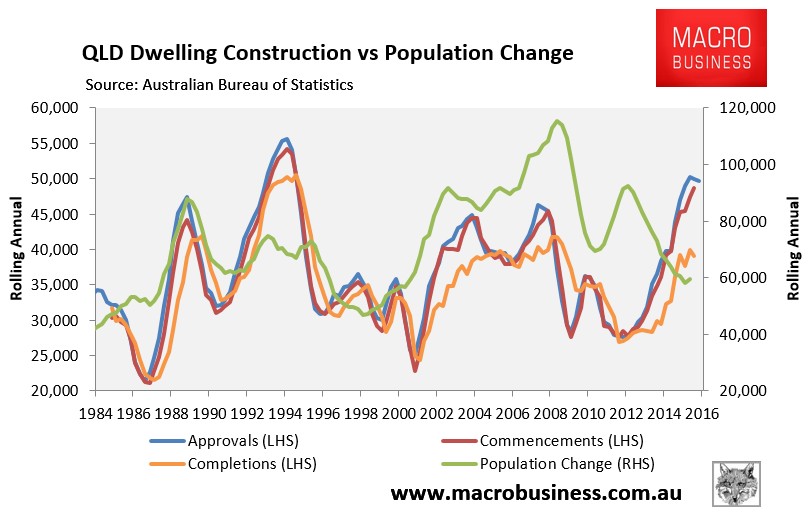
It’s likely to be a barren few years in both jurisdictions.
