On Friday, the RBA released its August Statement on Monetary Policy (SoMP), which contained some interesting analysis on the Perth rental bust:
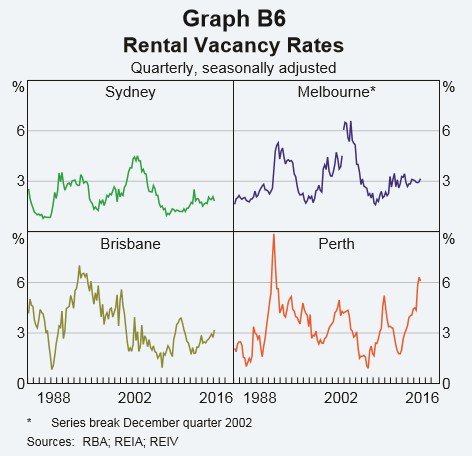
In Perth, the combination of slower-than-expected population growth, weaker household income growth and a high level of dwelling completions in recent years has placed downward pressure on housing prices. Rental vacancy rates in Perth have risen sharply to be more than double the average of all other capital cities, which is around 2½ per cent (Graph B6).
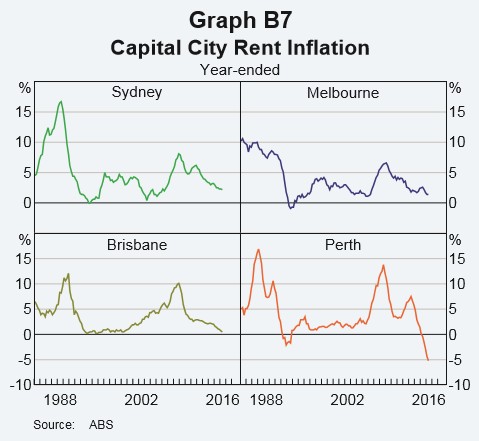
Consistent with this, rents in Perth declined by 51/4 per cent over the year to the June quarter 2016 (Graph B7)…
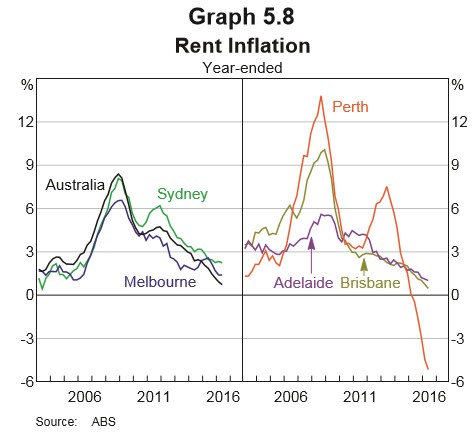
In Perth, rents have declined sharply, reflecting slower population growth and ongoing additions to the housing supply (Graph 5.8)… Developments in rent inflation are fairly persistent over time because the CPI captures all rents, not just the small proportion of agreements that are renegotiated each quarter…
Nothing we don’t already know. But some handy charts nonetheless.
Leith van Onselen is Chief Economist at the MB Fund and MB Super. He is also a co-founder of MacroBusiness.
Leith has previously worked at the Australian Treasury, Victorian Treasury and Goldman Sachs.