
Last Friday, the RBA delivered a veiled backhander to the Core Logic dwelling values index, noting the following in its August Statement of Monetary Policy (SoMP):
A range of indicators suggest that conditions in the established housing market have eased this year from very strong conditions over recent years. Housing prices were little changed in the June quarter according to most published measures…
In contrast, the headline CoreLogic measure of housing prices recorded very strong growth in April and May in a number of cities, to be more than 5 per cent higher over the June quarter. Recent information suggests that the strong increases reported by CoreLogic were overstated as a result of methodological changes affecting growth rates for the June quarter…
Other timely indicators of conditions in the established housing market continue to point to weaker conditions than last year.
In his weekly email newsletter, SQM Research’s Louis Christopher noted the view within the industry was that the Core Logic index was overstated:
“I can tell you now sections the finance and investment industry had already largely discounted it [the Core Logic index], communicating to me how inaccurate it was”.
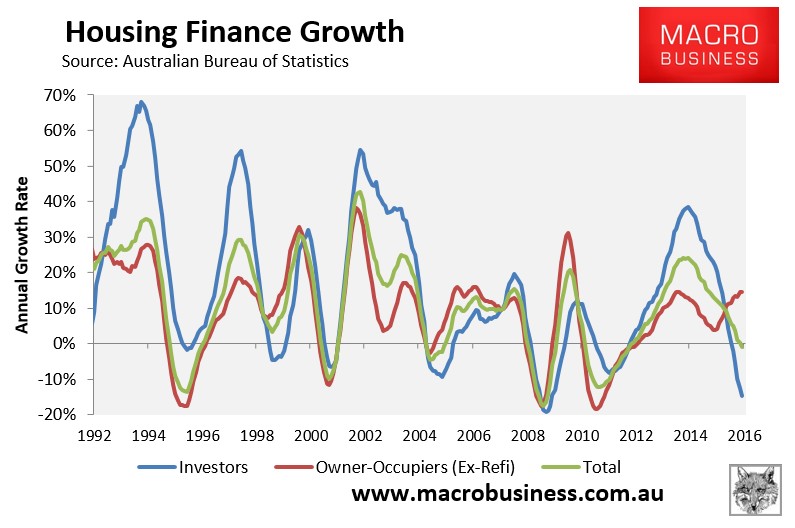
Indeed, the June housing finance data from the ABS, released on Wednesday, showed that the value of mortgage commitments (excluding refinancings) continues to trend lower, and that annual growth has actually turned negative, down 1% over the year:
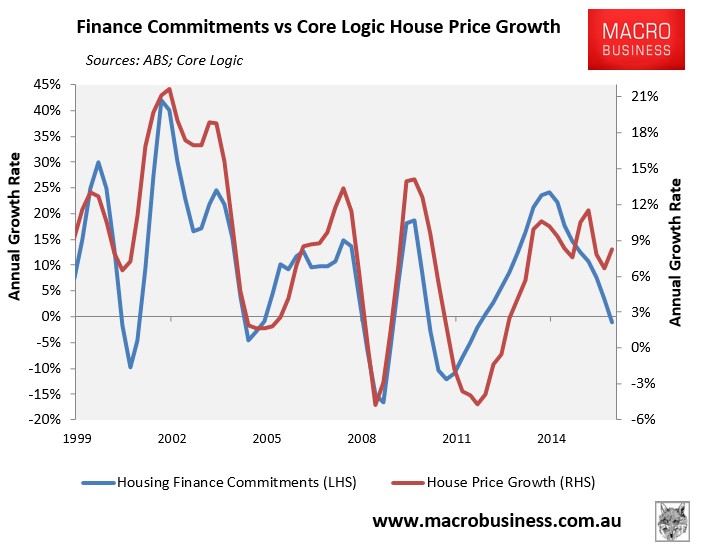
Other things equal, this should correspond with falling house price growth. However, the Core Logic index has bucked the trend strongly this year, suggesting something is awry with the index:
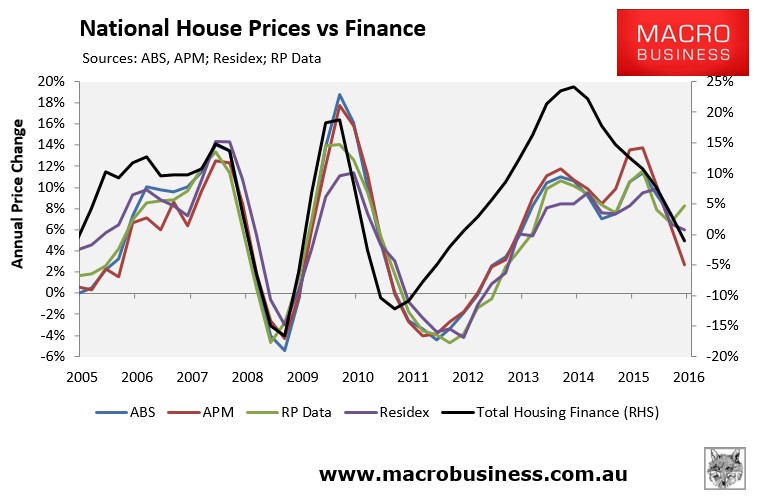
For the sake of comparison, I have also charted the above ABS housing finance data against the other major providers of house price indices, namely: the ABS and Residex (see below chart). Note, that I have left-out Domain (APM) at this stage, because its index only dates back to 2004:
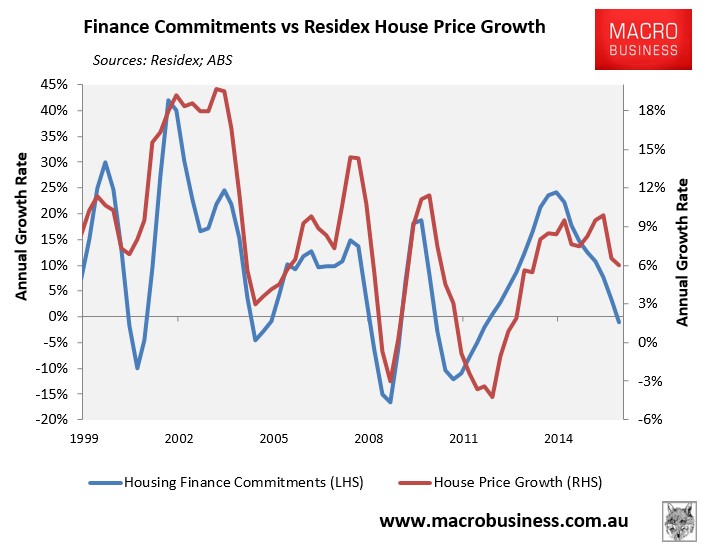
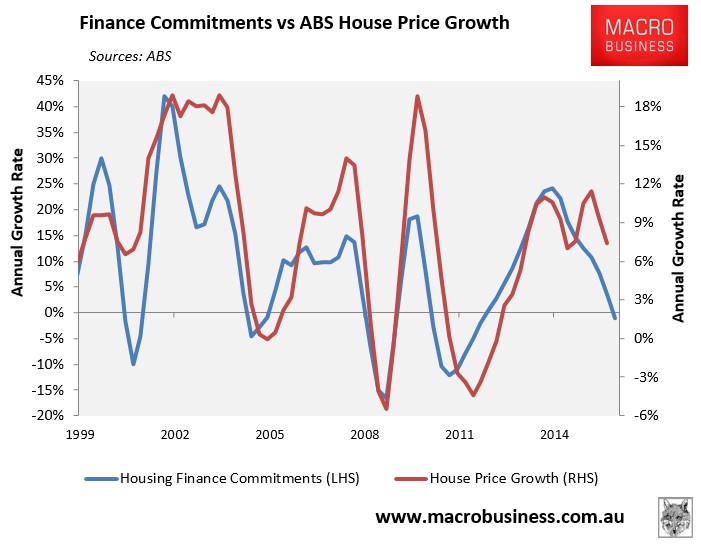
As you can see, these indices have also bucked the fall in finance commitments, which is unusual given historical relationships. But these two indices have at least recorded falling price growth over the past six months, unlike the Core Logic index.
In fact, plotting the four indices side-by-side against finance growth shows that Core Logic is definitely the odd one out, being the only index to record strengthening house price growth over the June quarter:
I should note that there are other potential reasons for the divergence between indices, the main one being that they measure house prices differently.
In a nutshell, both the ABS and Domain (APM) use variants of the stratified median price method, which controls for changes in the composition of properties sold by separating the total sample of properties into a number of geographical sub-samples, and then into different strata based on the long-term average price level of properties in those regions.
Core Logic uses a hedonic methodology, which measures price changes for both detached houses and units on a like-for-like basis according to their key attributes, such as location, land size, number of bedrooms and bathrooms, and so on.
Finally, Residex uses a repeat sales methodology, similar to the Case-Shiller Index in the United States, which calculates price changes based upon repeat sales of the same homes. In order to minimise the price-distorting effects that renovations have on home prices, Residex also employs a combination of the hedonic technology and stratified median index technologies used by the other providers.
There are also possible explanations for why house price movements have uncharacteristically decoupled from finance growth.
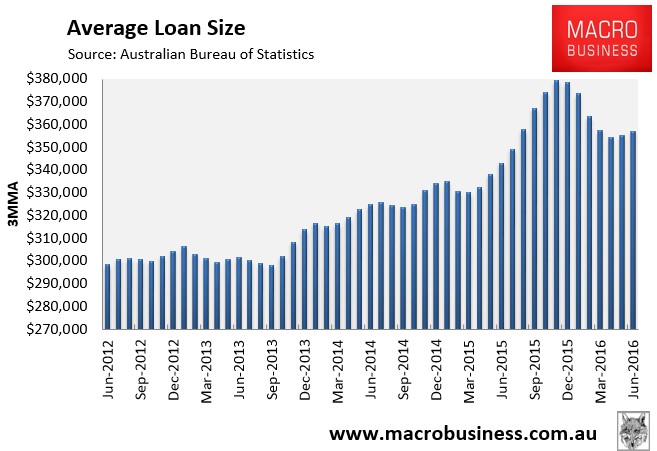
First, we know that transaction volumes have fallen, and it could be that volumes have fallen even more sharply than the value of finance commitments (i.e. fewer loans chasing even fewer properties). However, this explanation is complicated by the fact that the average loan size has also fallen sharply recently, which would usually correlate with falling dwelling values:
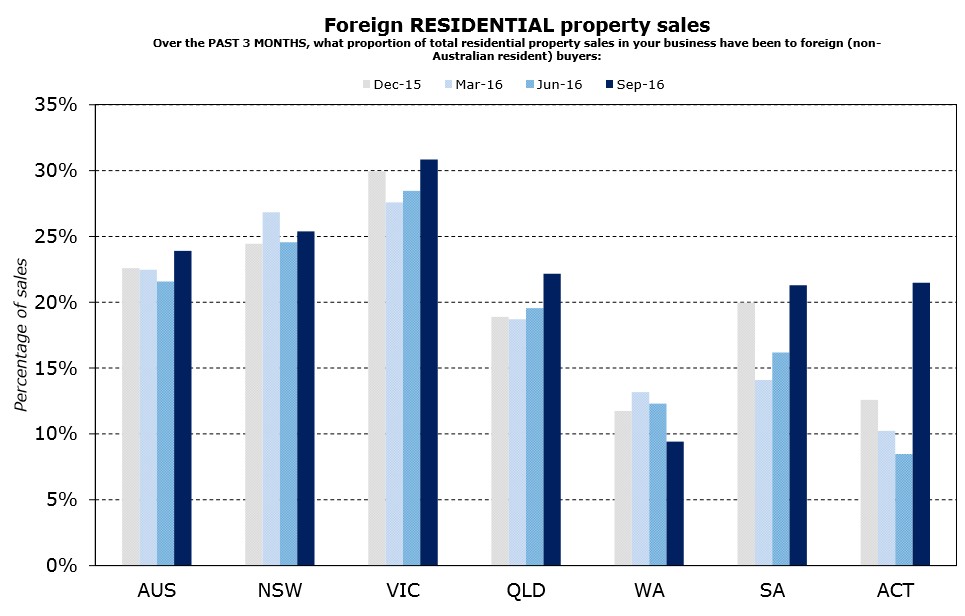
Second is the potential for cash buyers, such as buyers from overseas, whom are not captured in the housing finance statistics. We know that foreign buyers have been particularly active in Melbourne and Sydney, and that this demand could support prices even in the face of falling domestic demand:
Regardless, the total value of housing finance (excluding refinancings) remains the best single indicator of price growth that I can think of. And the fact that it is trending down sharply should eventually correlate with falling price growth.
