
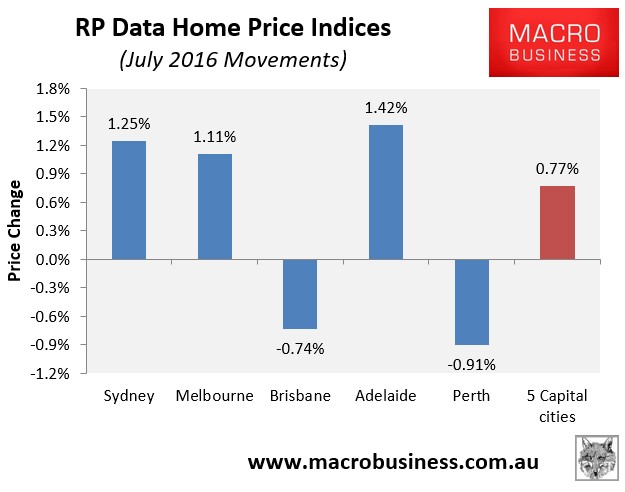
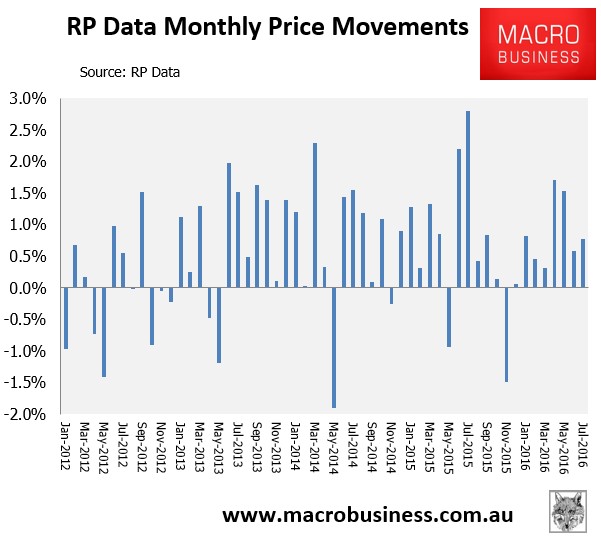
Core Logic’s dwelling price results are in for July, with a 0.77% rise in values recorded over the month at the 5-city level (see next chart).
It was the seventh substantive monthly rise in home values in a row (see next chart).
Over the quarter, price growth was a hefty 2.91% at the 5-city level, although it was down from 3.87% last quarter (see next chart).
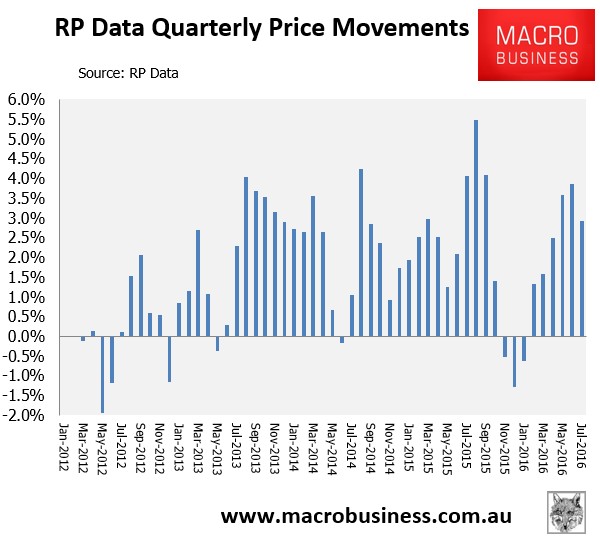
Over the quarter, values rose by an incredible 5.58% in Sydney, by 3.54% in Melbourne, and by 0.21% in Adelaide, whereas Perth dwellings fell by 4.30% and Brisbane’s fell by 0.41%.
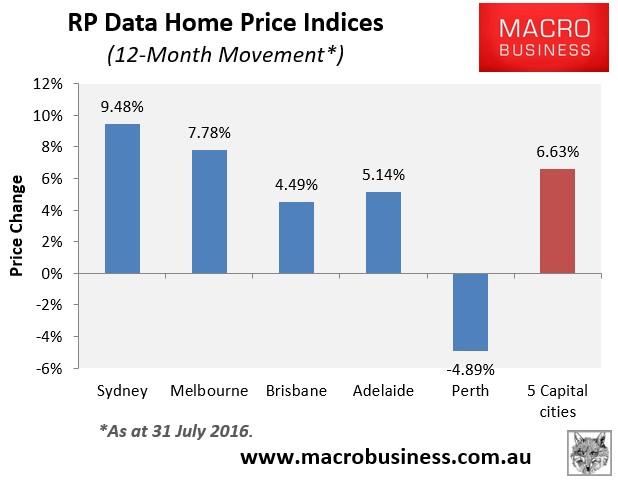
The next chart, which tracks trend annual price growth, shows that the big rebound in annual growth continues to reverse (see next chart).
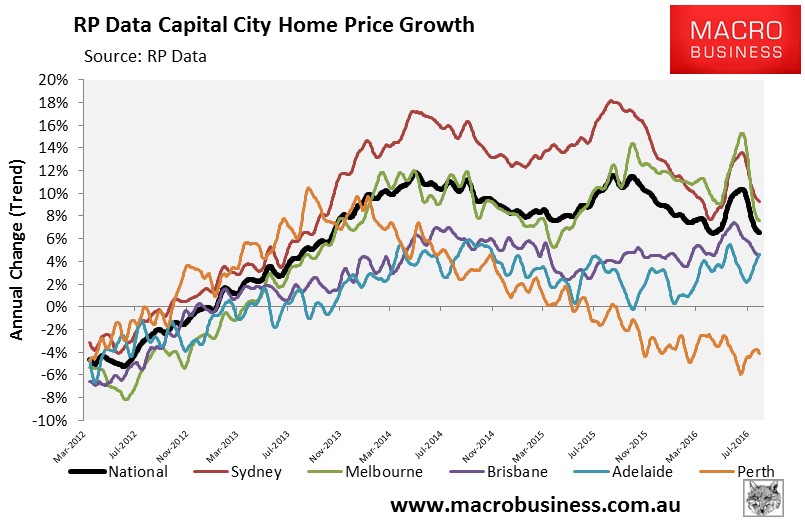
Sydney has once again become the strongest housing market in Australia when measured in annual growth terms, edging out Melbourne (see next chart).
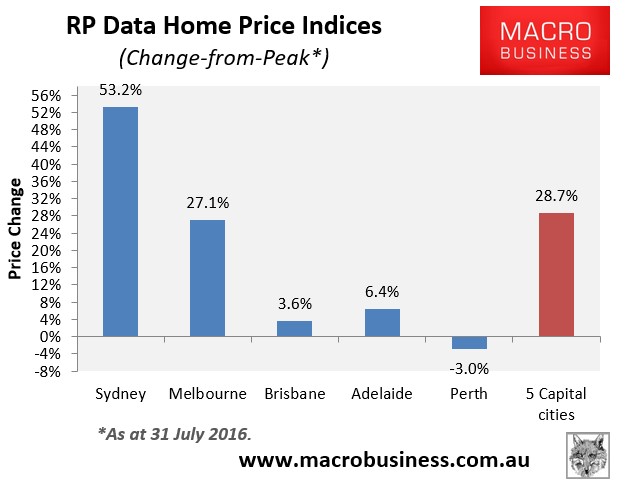
And values are now 28.7% above the October 2010 peak at the 5-city level, driven almost entirely by massive growth in Sydney (+53.2%) and to a lesser extent Melbourne (+27.1%), with the other major capitals not doing a lot (down in real inflation-adjusted terms):
Core Logic’s results continue to be at odds with the ABS housing finance data, which shows a weakening trend (see next chart).
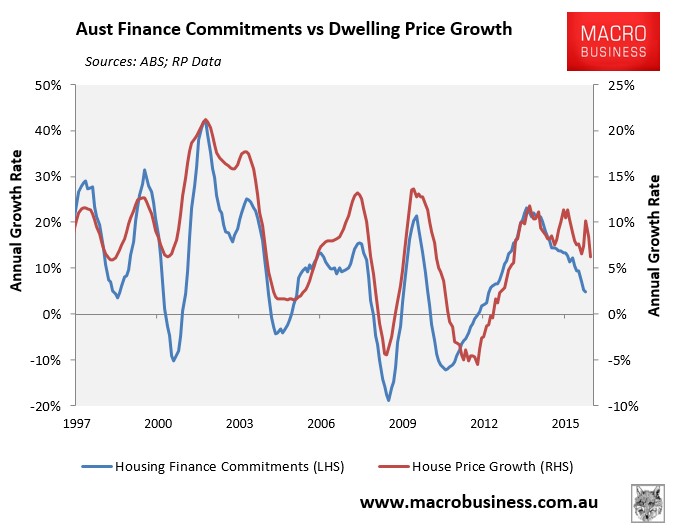
Again, this suggests less credit chasing even fewer dwelling sales volumes and/or more cash sales (e.g. to foreign buyers).
