
By Alpha Beta Strategy and Economics, republished with permission
GDP results were strong yesterday (+3.1%), but if you’ve listened to the commentary on Australia’s economy over the last year, you’d be forgiven for being a bit confused.
On one hand there are plenty of bullish signs: unemployment is steady (at 5.7%), exports are strong (up 6.6%) and the sky is full of cranes (commercial building approvals up 30%). These positive indicators all relate to Australia’s “production” (i.e. how much the economy makes).
But at the same time, there are lots of economic indicators flashing red: record low wage growth (2.1%), falling company profits (down -8.4%) and what is starting to feel like a permanent budget deficit. What these weak indicators have in common is that they all relate to “income” (i.e. how much we earn from what we produce).
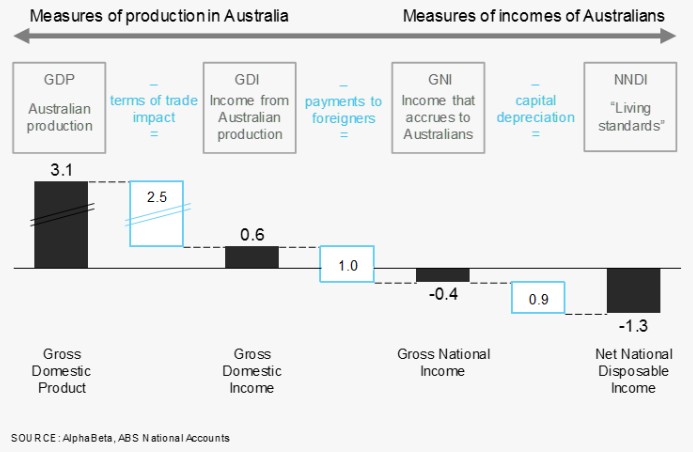 Today the ABS released four measures of Australia’s economic growth which show the dramatic difference between the strength of the ‘production’ measures of economic output and the weakness of the ‘income’ measures (see chart below).
 Australia’s Gross Domestic Product (GDP), which measures how much we produce, is cantering along at 3.1%. But our Gross Domestic Income (GDI) – which accounts for the fact that, although we are exporting more, the price of many of our exports has fallen – is growing much more slowly at just 0.6%.
This means we are producing more but earning less. In the simplest terms, if Australia was a cafe, we’d be making a lot more coffees but not taking much more money thanks to a price cut.
Australia’s Gross National Income (GNI) takes this one step further by subtracting dividends and other payments to foreigners to measure the income that actually ends up in the pockets of Australians (remember that much of our mining sector is foreign-owned). GNI is going backwards at -0.4%. Finally, Net National Disposable Income (NNDI) – which accounts for the capital we use in production to arrive at an estimate of what we really have left to spend – has slumped to -1.3%.
So while the mining boom left Australia with strong production growth, it has also saddled us with a legacy of factors (falling commodity prices, rising payments to foreign investors, higher depreciation) that are now weighing on incomes. Again, if Australia was a cafe, we’d have just suffered a price cut, a hefty interest payment to the bank and a bill for maintaining the equipment. The shop would be busier, but our take-home pay would be lower.
Why is GDP so strong?
You only have to look at falling commodity prices to understand why Australia’s income is falling. The more interesting question is: ‘Why is Australia’s GDP so strong?’
After all, the mining boom left us with one of the biggest falls in investment in our history. Business investment has now fallen for 13 consecutive quarters (the previous record was 11 quarters in the 1990s recession).
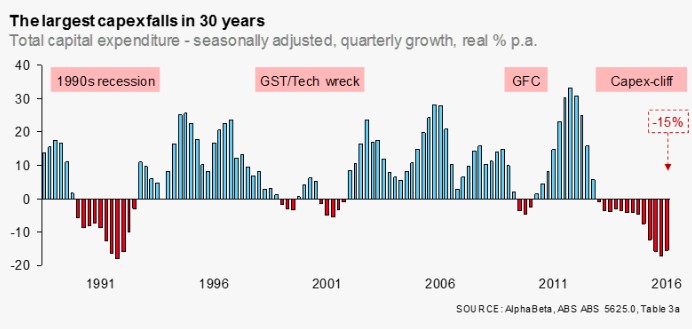
This fall has already punched a massive $73 billion (4.4% of GDP) hole in GDP relative to our expectations of investment three years ago.* This would normally be more than enough to push the economy into recession. So how has Australia managed to maintain reasonably steady GDP growth?
Just about every commentator will tell you that Australia avoided a recession by “transitioning to new sources of growth”. Unfortunately, that story just doesn’t fit the facts. If Australia had ‘transitioned’, then we would expect to see other components of the economy (exports, consumption, housing investment, etc) performing above forecast to fill the gap left by investment. But the chart below shows that exports haven’t filled the gap. Despite the strong number this quarter, exports have actually been weaker than expected over the past 3 years. Consumption has also been weaker than expected. And, while housing investment and public spending have been slightly stronger than expected, they are nowhere near enough to fill the investment hole.
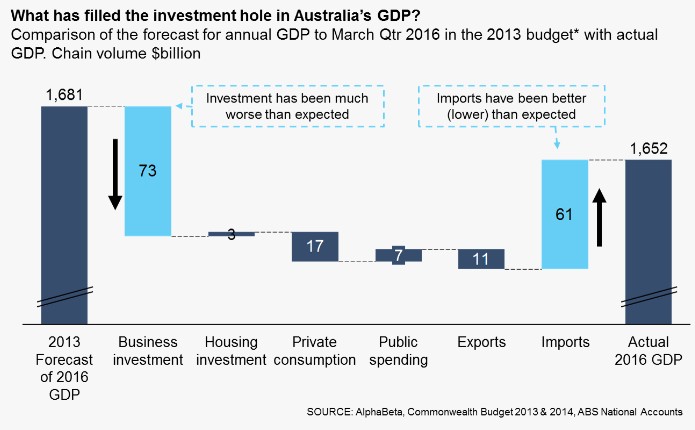
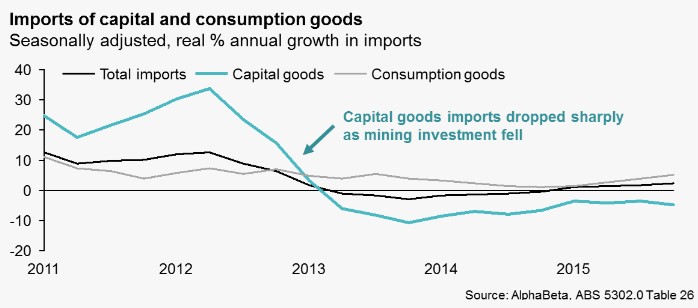
So what did fill the hole in GDP left by investment? The chart above shows that imports were $61 billion (3.6% of GDP) lower than expected and, since imports detract from GDP, they have cushioned much of the impact of falling investment. This fall in imports isn’t surprising as it’s little more than the flip side of falling investment – because much of that mining investment was actually trucks, excavators, crushers, conveyors and other plant and equipment. Much of it was imported, so when the investment slowed down so did the imports.
What does this mean for the future?
There is a lot of confusion about the Australian economy because production is strong but incomes are weak. That’s why we can simultaneously have record export growth with falling company profits; strong employment growth with low wages; and strong GDP growth with a crippled budget deficit.
Looking through the quarterly noise, GDP has survived the capex cliff over the last three years because the unexpected drag from mining investment was muted by a larger than expected drop in capital goods imports. But falling imports is hardly a good news story. And it’s certainly not clear evidence of the much vaunted “transition to new sources of growth”.
The fact is, whether you’re a cafe or a national economy, you should care less about how much you produce, and more about how much income you earn and the purchasing power of that income.
* 2016 GDP component forecasts based on 2013-14 Budget and subsequent part year based on Budget 2014-15 projection.
** All growth figures are annual year-ended unless otherwise stated.
