
China inflation is out for May and fell back to 2% on the CPI, lower than expected, whereas the PPI shrank-2.8% less than the -3.2% expected:
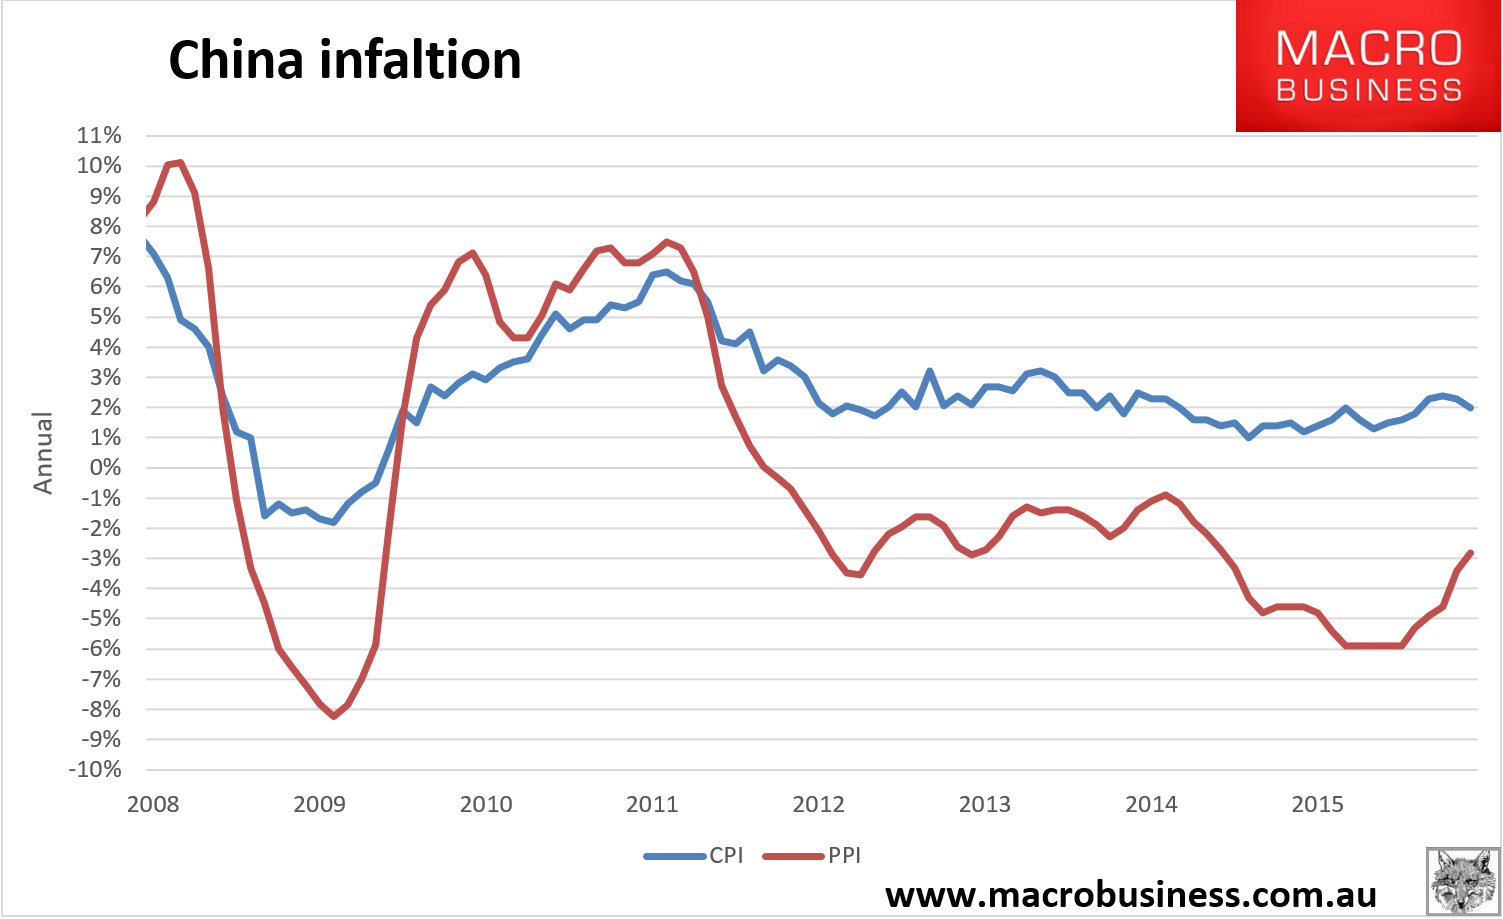
CPI is coming back fast as the pork scare passes:
May April March Feb. Jan. Dec. Nov. YTD
2016 2016 2016 2016 2016 2015 2015 2016
==============================
———————— YoY% ————————
Consumer Prices 2.0% 2.3% 2.3% 2.3% 1.8% 1.6% 1.5% 2.1%
By Region
Urban 2.0% 2.3% 2.3% 2.3% 1.8% 1.7% 1.5% 2.2%
Rural 2.1% 2.4% 2.2% 2.2% 1.5% 1.5% 1.3% 2.1%
By Nature
Consumer Goods 2.0% 2.5% 2.5% 2.6% 1.5% 1.5% 1.2% 2.2%
Services 2.1% 2.0% 1.9% 1.8% 2.2% 2.1% 2.1% 2.0%
By Type
Non-food 1.1% 1.1% 1.0% 1.0% 1.2% 1.1% 1.1% 1.1%
Food 5.9% 7.4% 7.6% 7.3% 4.1% 2.7% 2.3% 6.5%
Ex. Food & Energy 1.6% 1.5% 1.5% 1.3% 1.5% 1.5% 1.5% 1.5%
Ex. Vege & Fruits 2.1% 2.0% 1.7% 1.7% 1.6% 1.5% 1.4% 1.8%
———————— MoM% ————————
Consumer Prices -0.5% -0.2% -0.4% 1.6% 0.5% 0.5% 0.0% n/a
And PPI is still improving across the industrial landscape:
May April March Feb. Jan. Dec. YTD
2016 2016 2016 2016 2016 2015 2016
==============================
———————— YoY% ————————
Producer Prices -2.8% -3.4% -4.3% -4.9% -5.3% -5.9% -4.1%
Producer Goods -3.7% -4.5% -5.7% -6.5% -6.9% -7.6% -5.5%
Mining -9.6% -13.0% -16.3% -18.2% -19.8% -19.7% -15.4%
Raw Materials -7.2% -7.7% -8.8% -8.9% -9.1% -10.3% -8.3%
Manufacturing -1.8% -2.5% -3.6% -4.5% -4.9% -5.4% -3.5%
Consumer Goods -0.2% -0.2% -0.2% -0.4% -0.5% -0.4% -0.3%
Food 0.6% 0.7% 0.7% 0.4% 0.2% -0.1% 0.5%
Clothing 0.7% 0.7% 0.8% 0.7% 0.7% 0.7% 0.7%
Daily-Use Items -0.3% -0.5% -0.6% -1.0% -1.2% -0.9% -0.7%
Consumer Durables -1.7% -1.7% -1.7% -1.7% -1.6% -1.1% -1.7%
Mining is still the big driver of improvement with other gains slowing in the second derivative. The PPI usually gives us a good indication when China’s stimulus pulses begin to fade. Not yet.
