
With the release yesterday of the state investor finance data for February, it is now an opportune time to once again plot total finance commitments (excluding refinancings) as measured by the ABS against dwelling values as measured by Core-Logic RP Data.
First, below is the national picture, which shows finance approvals typically leading price growth (at least over recent years) and both heading lower:
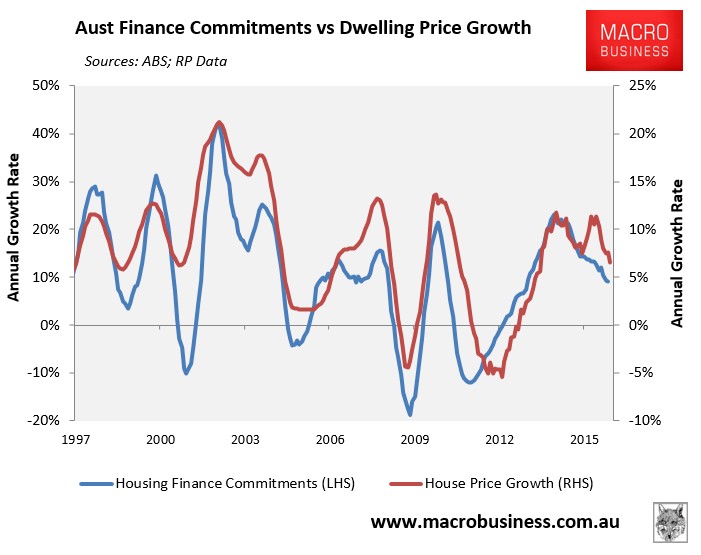
Across the five major capitals, there has also been a strong correlation between finance commitments and dwelling price growth; albeit with different lead/lag times:
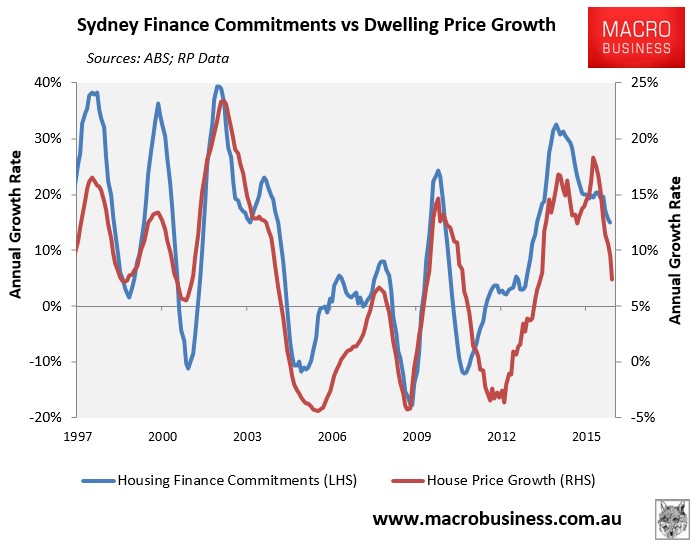
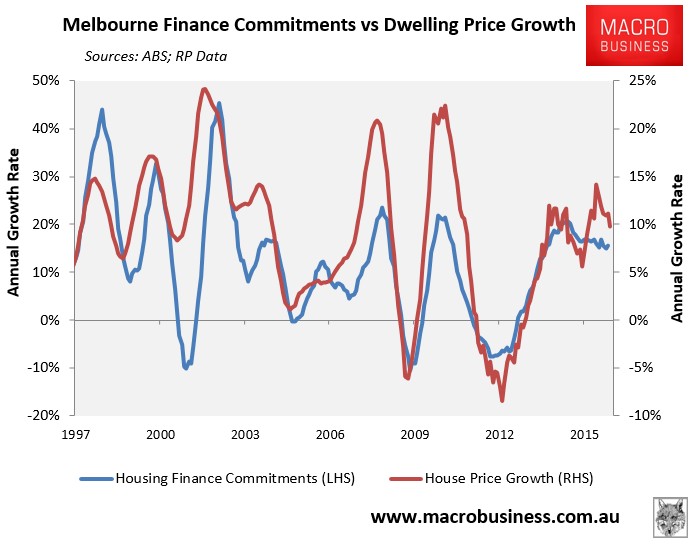
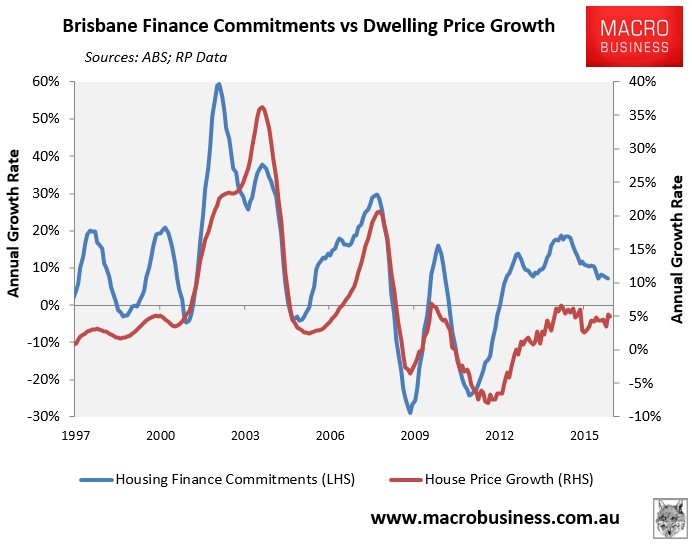
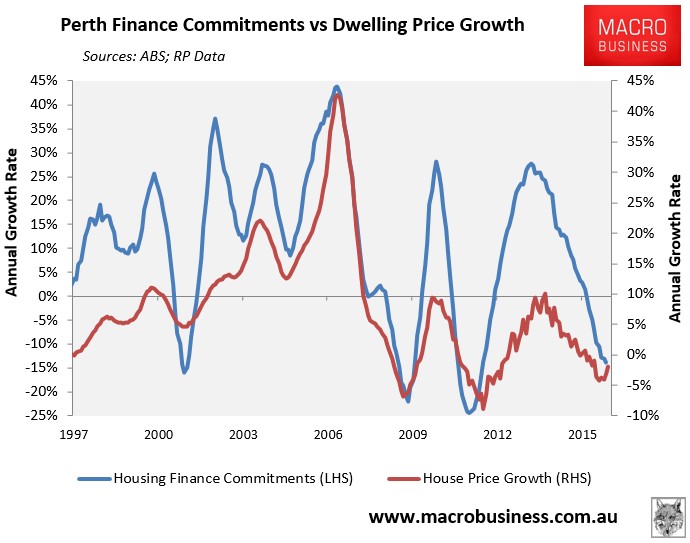
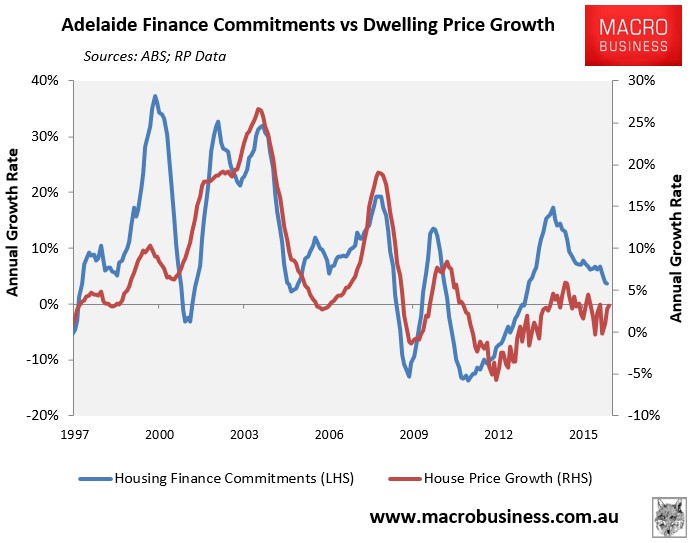
With housing finance growth past its peak in all major markets, it should also mean that price growth is also past its peak in each respective market.
That said, Sydney and Perth look to have by far the weakest momentum with growth in finance commitments plummeting across both markets, followed by Brisbane and Adelaide.
By contrast, Melbourne and Brisbane, while also experiencing falling finance growth, is holding up much better than its major capital city counterparts.
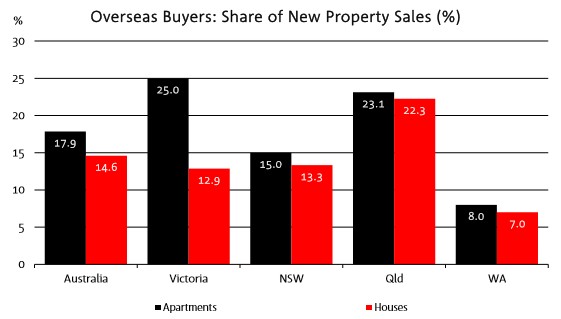
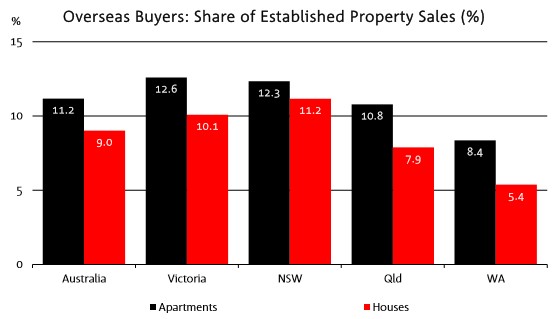
As always, the one potential ‘fly-in-the-ointment’ are cash buyers that are not captured in the housing finance statistics. We know that foreign buyers have been particularly active in Melbourne, Sydney and more recently Brisbane, and that this demand could support prices even in the face of falling domestic demand:
Nevertheless, the total value of housing finance (excluding refinancings) remains the best indicator of price growth that I can think of. And it is pointing down for each major market.
unconventionaleconomist@hotmail.com
