Bang goes yet more billions. China is still stripping dollars from national income. So although the iron ore price genuinely helps, Federal revenue writedowns between now and 2018-19 will cost $16 billion, with the bulk of them again in profit taxes. And spending is up too versus official forecasts – there’s been money thrown at the States and others to keep them sweet (or less sour) in an election year, plus the usual cost of ‘do nothing’ Senate delays.
Weak wages and inflation mean the economy is generating some savings on spending which will partially offset the costs of continued Senate blockages. But the bottom line is that deficits from here through to 2018-19 now look like weighing in at $129 billion – that’s $21 billion worse than the official forecasts in December’s MYEFO had them.
Hence our PEFO plea – talk straight, the nation really needs to hear it
2016 is an election year. That’s a big reason to hope the 2016 Pre-Election Fiscal Outlook won’t be like the last PEFO. The 2013 PEFO essentially assured voters that (1) within a decade, whoever they voted in would deliver over $80 billion a year in as yet unidentified savings on spending and that (2) much of the revenue windfall of earlier years was locked in. Err, that’d be ‘no’ and ‘no’, respectively. Back in 2013 we didn’t get a Pre-Election Fiscal Outlook. What got served up to the public was more of a Pixies, Elves and Fairies Outlook.
In 2013 the then shell game hid problems under a promise to ‘do something’. Although both sides took policies to the election that implied, from the end of the forward estimates, spending would then rise 3.7% faster than inflation out to the end of a full decade, they also relied on a PEFO that assumed there’d be unspecified savings to trim that back to 2% – a difference that, a decade on, ran to reach over $80 billion a year.
Today’s shell game is premised on the promise the States will do something – that the 2014 Federal cuts to State funding can be fixed by the States alone. Nuh, uh. The States barely raise any taxes of their own (and, by the by, some of those are among Australia’s worst when it comes to destroying jobs and growth). And while they could be heaps better at both cutting spending and raising taxes, they can’t fill a hole of the size that’s looming.
So will the PEFO of 2016 address the elephant in the room in the way that the 2013 PEFO signally failed to do? We can’t say we’re optimistic of that. After all, the new ‘magic asterisk’ involves a hospital pass to the States, whereas PEFO is a report on the Federal Budget. Hence Treasury and Finance might choose to play safe again. And, if they do, the electorate will once again be surprised when the Federal Budget remains just as broken as today as the continuing screams from the States inevitably lead to new raids on Canberra’s piggybank.
This year’s PEFO looms as a significant moment in our social compact with ourselves – the Budget. Hence our plea. Treasury and Finance can stick their heads in the sand again, thereby ensuring the electorate does the same. Or, like the red and blue books now under preparation, they can tell it like it really is to all Australians ahead of the election, rather than solely to the new Government after the election. Life hands you a handful of moments to stand up and be counted. For the authors of PEFO, this is one of those moments.
Beware revisions to the expected size of Australian national income
A worsening slowdown in China (and the knock on impact to profits and wages Downunder) is trimming forecasters’ estimates of national income – the key driver of the tax take. Although the Budget doesn’t explicitly forecast that, it does predict a cousin: nominal GDP. And we see yet another round of writedowns on that key measure.
MYEFO forecast nominal GDP gains of 2¾% in 2015-16 and 4½% in 2016-17, followed by further gains of 5% in 2017-18 and 5¼% in 2018-19. Our matching forecasts are 2.4% in 2015-16, followed by 3.1% in 2016-17, 4.6% in 2017-18 and 4.4% in 2018-19. Our estimates imply a steadily rising shortfall. By 2018-19 national income is projected to be some 2.8% – or more than $50 billion – smaller in that year than Treasury estimated it would be in MYEFO. And because Federal taxes and charges account for almost a quarter of national income, that implies some revenue writedowns are headed our way on Budget night.
That may not be your impression. In fact, were current iron ore pricing in spot markets to last it would add some
$15 billion to the tax take over the current four year period. But (1) wage growth is lower than ever, and (2) an upward blip in the $A is undoing the boost to corporate profits from higher commodity prices. That combo strips dollars from the nation’s pockets.
Equally the usual linkage – whereby almost a quarter of losses to national income forecasts show up as a reduced tax take – may be too pessimistic in current conditions. Were that rule of thumb to hold true, we’d be forecasting revenue writedowns close to $30 billion by 2018-19, whereas we actually calculate something closer to half that. That’s because although the lift in iron ore pricing isn’t enough to lead to a net write up in national income, it does act to notably blunt what would otherwise be even larger tax writedowns. (In effect, recent commodity price gains have made the composition of national income a bit more ‘tax friendly’).
The other good news is Treasury’s forecasts of national income may well be more optimistic than ours. If they follow standard practice, they’ll adopt Department of Industry commodity price forecasts. (We think those forecasts are too optimistic. Let’s hope we’re wrong.)
Just when you thought it was safe to go back in the lock-up: more writedowns
An old story: yet more company tax writedowns. Major miners, who account for a sixth of company tax in an average year, have taken huge profit hits. Overall profit taxes are forecast here to fall $4.7 billon shy of the latest official estimates for 2015-16, though the better news on iron ore prices trims that shortfall to $2.3 billion in 2016-17.
There are specific pain points. Although company tax dominates total writedowns for profit taxes, special mention needs to go to resource rent taxes, which continue to head the way of the dodo. Low oil and gas prices now seem to be lingering longer than a great aunt at Christmas, with commensurate carnage in collections. And spare a thought for superannuation taxes, which are suffering from further downward revisions after a horror run in recent times. The sharemarket has been battered since MYEFO, so super taxes have similarly suffered. Finally, despite the tail end of a massive boom in housing prices, those same sharemarket woes pose problems for the capital gains tax take – which official projections have as the fastest growing tax of all, but whose ability to achieve lift-off has disappointed more consistently than the Sydney Roosters forward pack.
Wage woes, job joy. The GFC initially blew profit taxes out of the water, but recent revenue writedowns featured personal taxes, as weaker-than-expected wage growth outweighed the impact of better-than-expected job gains. The past six months delivered more of the same, but on a reduced scale. We do project net writedowns on taxes raised on individuals. But, at less than $1 billion in both 2015-16 and 2016-17, they aren’t the star of this year’s show.
Even markets are conspiring to white ant revenues. Recent times saw a falling Aussie dollar, which revved up the Reserve Bank dividend. But the $A zigged rather than zagged of late, while interest rates remain really, really low – a combo that keeps non-tax revenues looking weaker than official expectations too.
Spend, spend, spend. The good news gold medal goes to indirect taxes. Policy makers aimed to fill the pothole left by falling profits and collapsing engineering construction via low interest rates. And it’s working: the punters have been spending even though wage growth is rotten, while the China boom has been replaced by a housing price boom – which adds even further to spending. So too does the fall in the $A, as it adds to import prices, and hence to customs duty collections. That combo is set to shower the Budget with its only good news. And, even then, these are 2015-16 write ups, with this indirect tax dividend dropping in 2016-17 alongside momentum in housing prices.
The bottom line? The Budget boom of the past decade continues to become a Budget bust. The combination of China’s slowdown, still rotten commodity prices and weak wage growth have cut overall revenues by $4.1 billion in 2015-16, and the damage remains large, with a further shortfall of $3.5 billion in 2016-17.
That says we have a revenue problem as well as an even bigger spending problem, and that revenue problem is becoming more apparent. As usual, our comments above come back to our favourite four word summary of what happened to the Budget: temporary boom, permanent promises. The last decade saw a temporary revenue boom – notably in profit taxes – that subsequently tanked. But whereas the impact of China and the resources boom on the Budget came and went, the impact of politicians’ promises has lingered.
Speaking of spending problems, the Senate has never found a populist cause it couldn’t champion, and a further six months delay of a bunch of measures comes at an extra cost to the Budget. And it’s an election year, so backpedalling on savings discipline is the order of the day. The States have been given back money for hospitals that had earlier been cut, while the same is true for clean energy agencies – whose demise has been undone.
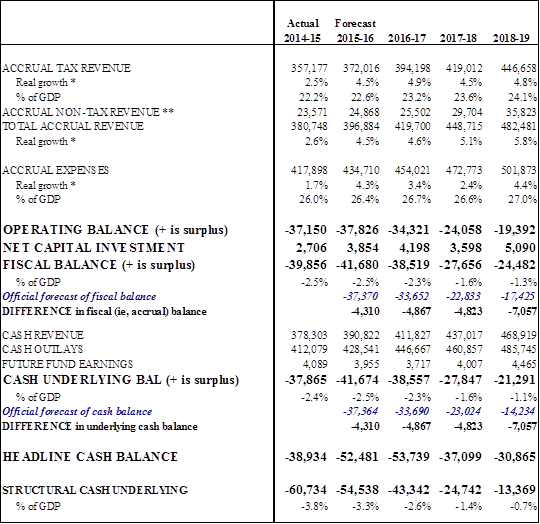
The upshot is that we project an underlying cash deficit of $41.7 billion in 2015-16. That is a substantial
$4.3 billion worse than projected at MYEFO (and it shows a worsening on the deficit of $37.9 billion recorded in 2014-15).
From there, the deficit stumbles in the right direction, coming in at a projected $38.6 billion in 2016‑17, though that is still $4.9 billion worse than expected at MYEFO. So despite all the rhetoric and (Senate aside) a range of efforts to rein in the deficit, the ongoing tug of war between policy and the economy sees the task of Budget repair going next to nowhere in the short term. Even the sobering forecasts above may yet turn out to be relatively wishful thinking given (1) an approaching election, (2) China stumbling and (3) the Senate grumping.
What about 2017-18 and 2018-19?
Some people think leadership, good or bad, packs more wizardry than a Hogwarts reunion. But it really, really doesn’t. China is still a nation dealing with a tricky transition; coal and iron ore prices, despite recent gains, remain truly rotten; while the $A continues to float above where fundamentals would otherwise have it pinned; and wage growth is crawling. So whereas many hope the long and intensely gothic horror stories underpinning virtually every Budget update since 2011 have finally run their course, that’s not what our projections show.
It is true that spot iron ore and coking coal prices are about $A15 more per tonne than in the Mid-Year Review. But that’s not cavalry coming over the hill: they’re pixie horses. Yes the iron ore boost is welcome, but some of it may be temporary, and there are other challenges. Both personal income taxes and spending taxes are expected to escape unscathed, but profit taxes have borne the brunt of Budget woes in recent times and, with shortfalls of $3.3 billion in 2017-18 and a larger $4.7 billion in 2018-19, that isn’t expected to change.
The upshot is total tax collections are expected to undershoot Treasury expectations by $3.5 billion in 2017-18, and then by a further $4.1 billion in 2018-19. And, in an election year, the Government has already reversed some previously announced spending cuts. So, based on newly announced policy, we expect spending to be around $1.0 billion more than the official forecasts in 2017-18, growing to $2.5 billion in 2018-19.
That says both China and Canberra continue to pile onto the deficit. Absent further policy change, we see cash underlying deficits of $27.8 billion in 2017-18 and $21.3 billion in 2017-18. That is $4.8 billion and $7.1 billion worse, respectively, than Treasury projected last December. You may wish to wave that away. Hell, so do we.
But to go all highfalutin’ on you, the biggest policy question of the last decade was just how wrongfooted the Budget was during the resources boom. We knew money poured in during the good years and then poured out again more recently. But what we didn’t know was how much of the extra money during the years of fat would prove sticky – the permanent improvement in the Budget as a result of the rise of China. And although you can argue the decimal point, to the nearest round number it is more and more clear the ongoing Budget benefit was … nuthin’. Zip, zero, zilch.
Yet that temporary boom was accompanied by permanent promises. Some of those (such as the full cost of the NDIS) will mount very rapidly. That doesn’t say we shouldn’t pursue worthy goals such as the NDIS: we should. But our social compact remains quite badly broken. And the otherwise healthy change of focus in the debate onto tax reform (or the lack of it) shouldn’t let public sector budget repair slip off the national ‘to do’ list.
Given the headwinds, Australia’s economic performance has been a genuine standout. But those headwinds howl loudest for the Budget, as they show up most in weak national income growth, and the Budget is powered by income taxes. And at the same time the economy is (or will be) doing few favours for the tax take, a bunch of policy promises are still ramping up in cost. So if you thought the long nightmare of revenue writedowns has finally run its course, then you’d better keep hiding under a blanket – or risk some disappointment.
In brief (1) we think most fiscal mistakes have been in spending, and that’s where the bulk of Budget repair is needed, (2) but we have a revenue problem too, and a shift to higher taxes could achieve tax reform at the same time as lifting the tax take, (3)yet these developments – decisions to cut spending and to raise revenue – don’t have to achieve a better Budget position tomorrow. It’s OK to take a decade to get there. Finally, however, (4) it isn’t OK to wait a decade to know what policymakers are planning. Figure out the medicine the Budget needs to take, and then be honest about that with the punters.
Bracket creep is crawling
Inflation keeps pushing people into higher tax brackets – an ungainly and unfair way to raise taxes. But with wages stuck near record lows, creep is crawling. PAYG collections in 2015-16 would be $1.7 billion lower this year if the 2014-15 thresholds were indexed (note we ignore the ‘temporary Budget repair levy’ – we assume a top rate of 45% rather than 47%). And bracket creep then keeps rising to reach $4.1 billion in 2016-17, $5.0 billion in 2017-18, and $7.5 billion in 2018-19 (meaningthe tax paid by average taxpayers in 2018-19 will be $7.5 billion more in that year than if they faced indexed 2014-15 rate scales).
Yet, as we keep saying (and now finally people are listening), weak wage growth means bracket creep is crawling: given that it is averaging just $1.9 billion a year, bracket creep in Australia is a problem rather than a disaster.
Debts and deficits
The longer term Budget outlook is covered in caveats:
First, a swag of existing programs become more expensive – the NDIS, child care and paid parental leave, hospital and school funding, carer support, aged care, Medicare and the PBS, disability pensions, age pensions, universities and Defence. That means much of the Budget is already promised to grow fast, with the bulk of that pain falling just beyond the current forward estimates.
Second, the Senate is still saying nyet to the savings options in front of it.
Finally, an ageing population and rapid health cost growth will bite into the Budget.
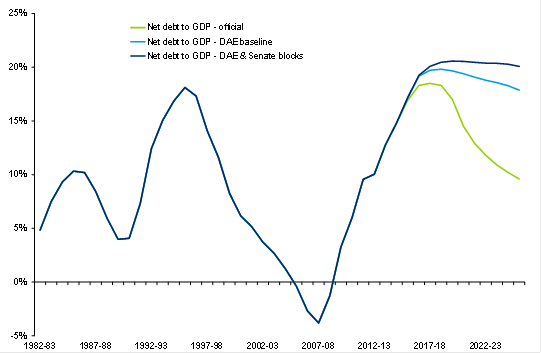
The chart below shows two sets of downgrades to official net debt estimates. The first simply adopts our forecasts, and then allows for a structural deficit that continues at the level we estimate for 2018-19 (the last year we examine in detail). The final line then assumes that the savings stuck before the Senate – yet still factored into the official forecasts – don’t occur. Our forecasts imply that net debt peaks at just under 20% of annual national income, and only edges down in the next decade – across a period in which Australia will have racked up a third of a century without a recession. And adding in Senate constipation means that debt rises above 20%, and essentially just sits there.
Both our forecasts and the addition of Senate costs imply a peak in debt comfortably above where it peaked in the aftermath of the recession of the early 1990s – and hence above debt ratios that previously triggered downgrades in Federal debt by ratings agencies.
To be clear, too many people yell too much about downgrade risks. Were the rating agencies to downgrade Australia’s AAA rating – on any of the forecasts noted below – we think they’d be making a mistake. Australia has a deficit problem rather than a debt problem.
But there’s a character issue that’s increasingly in question. Our living standards roared up through the resources boom, but Government of all stripes have used an increasingly entrenched Budget deficit to shield the punters from the fact that the pay rise that China granted Oz during the resources boom has since been withdrawn.
Make no mistake: our deficits aren’t the result of big investments in the future – they’re the result of pretending to the punters that the boom is rolling on. At some stage politicians of all sides need to be more honest about the need for spending cuts and tax increases. Despite this being an election year – or even better, because of it – that time should be now.
Budget repair isn’t urgent. We have time. But both sides of politics strikingly mismanaged our finances through the boom years, and the repair task is a big one.
David Llewellyn-Smith is Chief Strategist at the MB Fund and MB Super. David is the founding publisher and editor of MacroBusiness and was the founding publisher and global economy editor of The Diplomat, the Asia Pacific’s leading geo-politics and economics portal.
He is also a former gold trader and economic commentator at The Sydney Morning Herald, The Age, the ABC and Business Spectator. He is the co-author of The Great Crash of 2008 with Ross Garnaut and was the editor of the second Garnaut Climate Change Review.