Advertisement
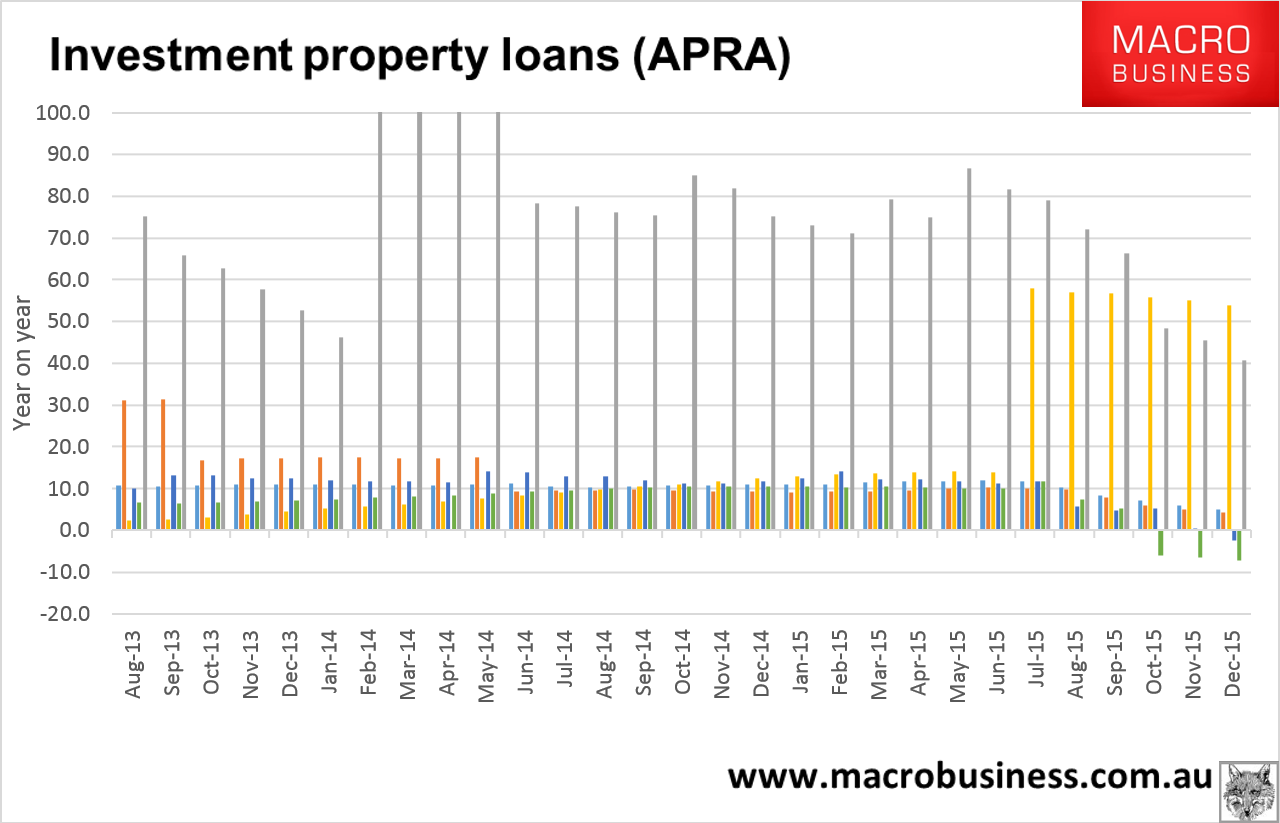
We need to take this data with a big grain of salt given the number of mysterious portfolio adjustments going on but the big slowdown in investors lending continued into January in the top six banks, here are the growth rates:
| ANZ | CBA | MAC | NAB | SUN | WBC | |
| Jan-16 | 3.9 | 3.4 | 36.5 | 52.5 | -5.1 | -7.7 |
| Dec-15 | 5.0 | 4.2 | 40.6 | 53.7 | -2.5 | -7.2 |
| Nov-15 | 6.0 | 4.9 | 45.5 | 55.1 | 0.5 | -6.4 |
| Oct-15 | 7.1 | 6.1 | 48.5 | 55.6 | 5.2 | -6.0 |
| Sep-15 | 8.4 | 7.9 | 66.3 | 56.6 | 4.8 | 5.2 |
| Aug-15 | 10.2 | 9.7 | 72.0 | 57.0 | 5.6 | 7.3 |
| Jul-15 | 11.7 | 10.1 | 79.1 | 58.0 | 11.7 | 11.7 |
| Jun-15 | 12.0 | 10.2 | 81.6 | 14.0 | 11.1 | 9.9 |
| May-15 | 11.8 | 9.9 | 86.8 | 14.1 | 11.6 | 10.0 |
| Apr-15 | 11.7 | 9.5 | 74.8 | 13.9 | 12.1 | 10.3 |
| Mar-15 | 11.4 | 9.3 | 79.3 | 13.6 | 12.1 | 10.4 |
| Feb-15 | 11.1 | 9.2 | 71.0 | 13.3 | 14.1 | 10.2 |
| Jan-15 | 11.1 | 9.2 | 73.1 | 13.0 | 12.5 | 10.4 |
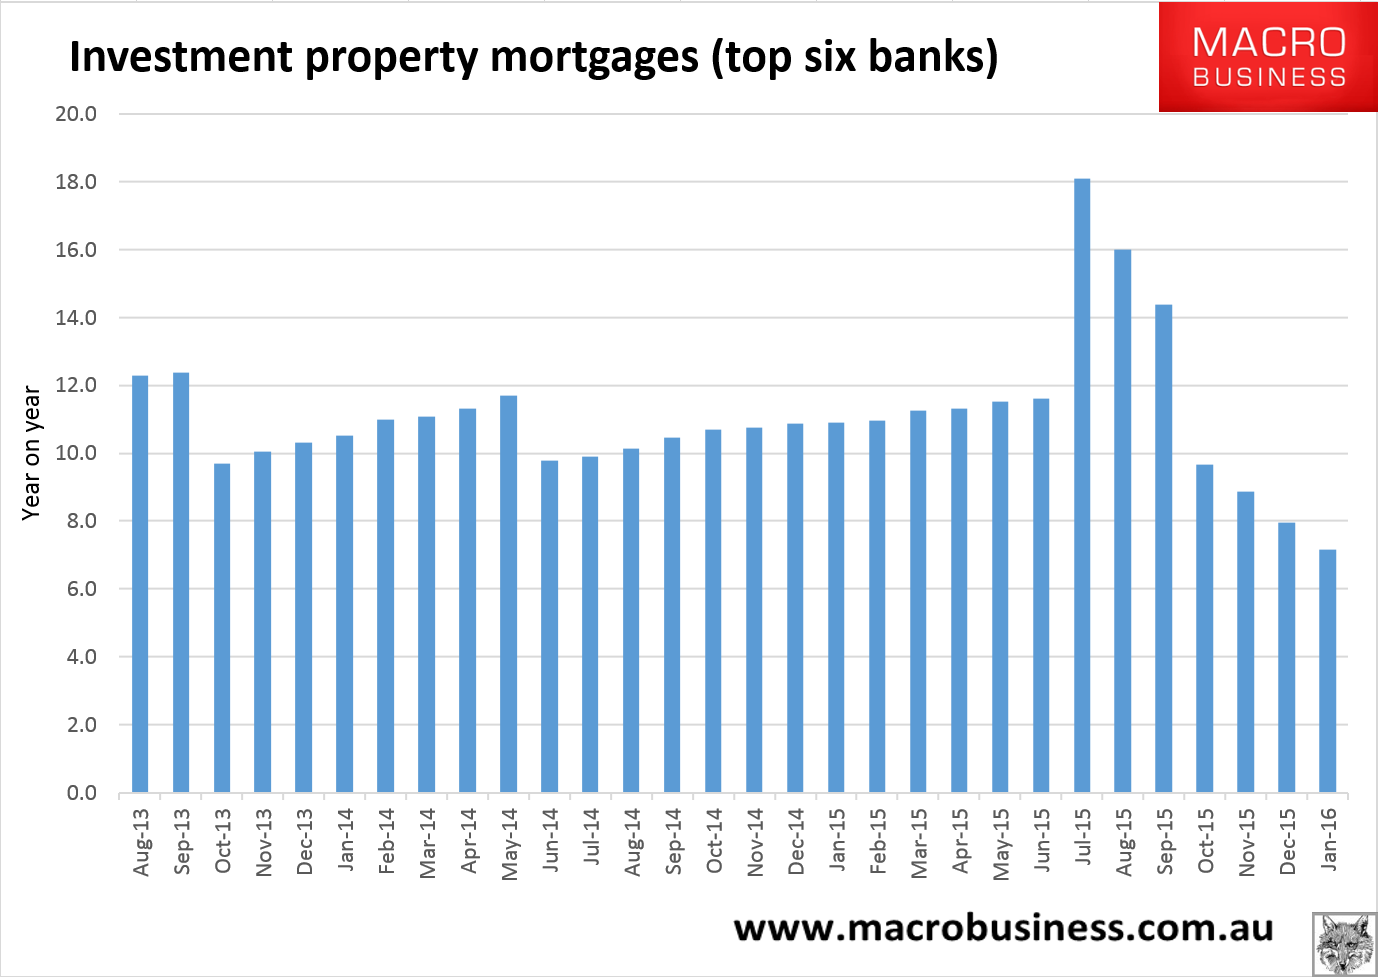
And the trends:
The total book is virtually stalled and the year on year growth rate falling fast at 7.2%:
Advertisement
The full text of this article is available to MacroBusiness subscribers
Cancel at any time through our billing provider, Stripe
About the author

David Llewellyn-Smith is Chief Strategist at the MB Fund and MB Super. David is the founding publisher and editor of MacroBusiness and was the founding publisher and global economy editor of The Diplomat, the Asia Pacific's leading geo-politics and economics portal.
He is also a former gold trader and economic commentator at The Sydney Morning Herald, The Age, the ABC and Business Spectator. He is the co-author of The Great Crash of 2008 with Ross Garnaut and was the editor of the second Garnaut Climate Change Review.