
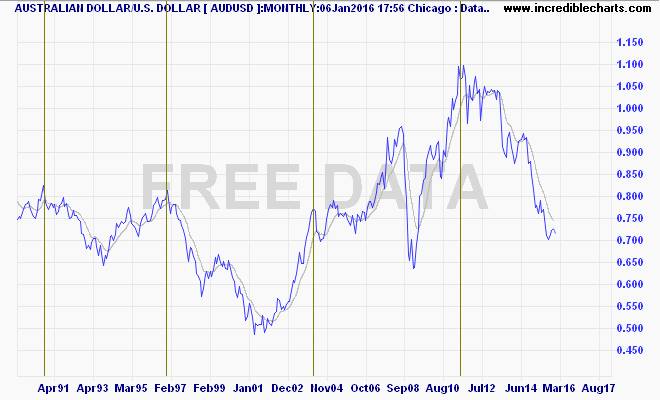
Regular MB reader “Avid Chartist” put me on to an idea on his blog that has been around for awhile – the so-called seven year cycle. His thesis revolved around the tops in the USD, as measured by the US Dollar Index (DXY), but through the viewpoint of the Australian dollar. Here’s the long run AUDUSD chart with major tops marked:
But I’m looking a bit closer at the Australian share market, after having to stifle a laugh when going through the latest Commsec Chart Pack. Hows this for using a ruler!
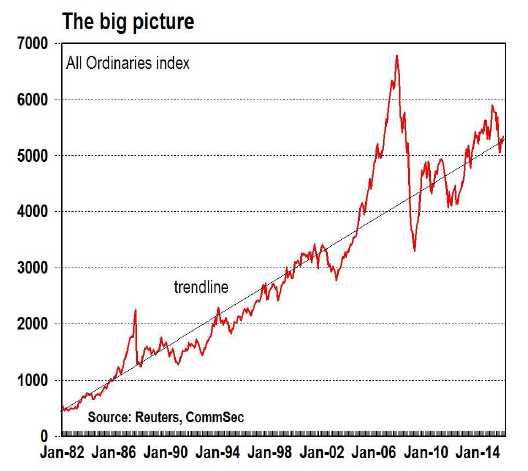
Showing “the long run average” as being a beautiful straight line through the biggest bull market in history is a little, well, ambitious. Even if you bought at the tops (and assuming you bought the index and not the best runners of the day who haven’t survived or have been re-weighted out of the index), on average it takes seven years to return back to that beautiful trendline. On the other side of the investing equation – retiring – just don’t retire at the tops…
This period was called “The Great Moderation” – a demographic, economic and political juncture that engineered the biggest broadest asset appreciation seen in history. Not just shares, but property, bonds and commodities – everything. We’re seeing the reversal of the latter now, and in most parts of the developed world, reversal of property bubbles and possibly the bond bubble as interest rates possibly return to normalcy.
The last three decades of Australian share market performance have been the best ever, averaging 9.4% on each rolling decade since 1975. Only the decade before that (before the oil crisis wiped out all returns for a decade) came close at 8% – the real average is between 3 and 4%!
The true long run view goes back to 1938 (or even 1875 if you want to calculate a broader, but rougher view) when the first Australian index was published and calculated:
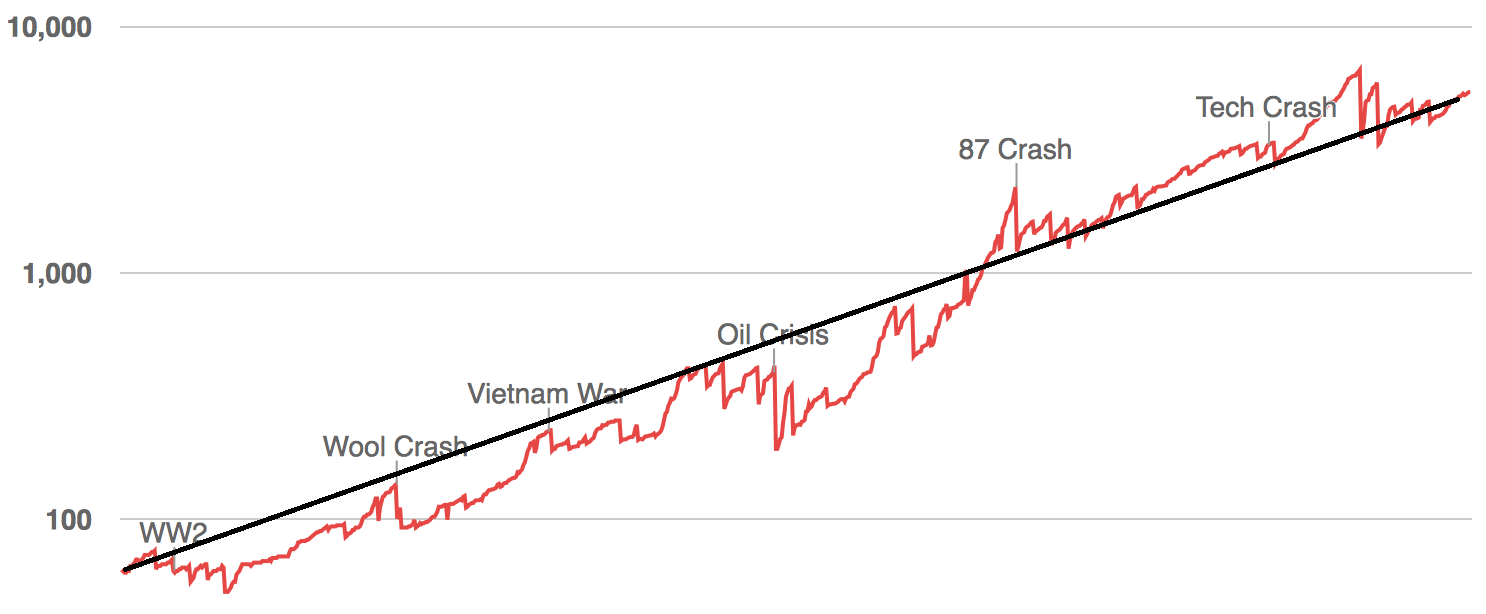
That’s my ruler superimposed and on the semi-long chart it looks just as impressive as Commsecs. Of course, inflation is a wonderful thing, as is survivorship bias, and we all don’t live to 100.
The average stock market return has been 5.1% per annum. Inflation since 1938 has also been 5.1% – ouch!
Number of companies that have failed and been removed from the index? Lots. Big ones too – not just fly by nighters and mining companies.
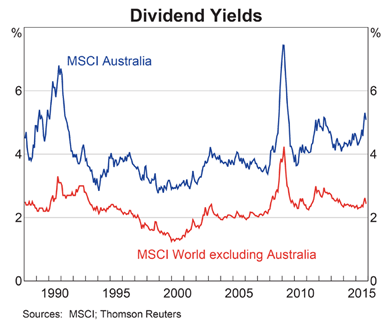
What about dividends you say! Therein lies the rub. Australian stocks have traditionally paid very well on dividends – part of the reason why they don’t grow so well as companies, compared to overseas and why bank stocks dominate over industrials. Paying a 5% dividend yield sounds great, but not when your company can turn those funds into 20% plus returns. Its a dumb policy, appeasing to shareholders, but its what makes the ticket punching/CEO/analyst wining and dining crowd turn around.
And when markets are in a bullish phase, the growth in dividends can be astronomical, with annual payments exceeding the original share purchase price. But when markets are flat, it nominally can outperform cash – in low inflation periods – but not volatility. Cash will always underperform stocks, but we’re not comparing savings with investing here.
So what – now we can just buy the index and sit back for the long term. Yes, it can be a good strategy, in fact almost all actively managed “stock picking” funds pretty much just follow the index. But then you have to overcome survivorship bias – where the index de-lists all the failed or failing companies and picks up the new bright boy in town, thus increasing ever higher. This can only be done with a truly weighted index fund, and Vanguard has only been doing this locally since 1998, with other index funds and exchange traded funds only recently coming to the fore in copycat mode.
Has this mechanism, which eliminates survivorship bias, reduces management and transaction fees (so you dont need to buy every stock in the index) and re-invests the dividend stream, provided good returns?
The retail Vanguard Index Australia fund, after fees but before tax has returned just over 8% per annum since inception, equally split between 4% in nominal growth and 4% in dividends. In the last 10 years, it goes down to 4.9% per annum, again equally split.
So be wary of straight line rulers applied to extremely volatile charts, promising 10% per annum AVERAGE returns. History shows this to be well above average and while predictions are hard to make about the future, the drivers for future returns on the Australian share market are facing tremendous headwinds, in stark comparison to the beginning of the Great Moderation.