
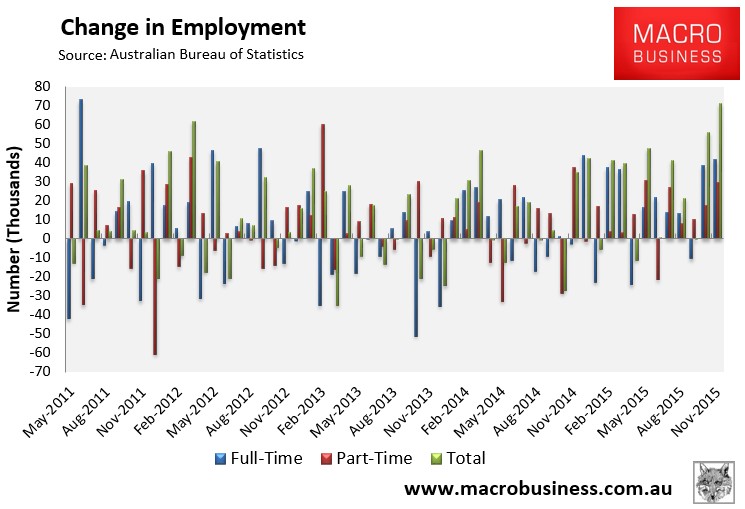
As summarised earlier, the Australian Bureau of Numberwang (ABN) has today released a farcical labour force report for November, which registered the strongest monthly jobs growth since July 2000 (+71,400), which came on top of last month’s turbo-charged result (+56,100). So according to the ABN, 127,500 jobs were supposedly created in just two months – the biggest back-to-back jobs gains in 28 years (i.e. since December 1987 and January 1988).
Not surprisingly, then, the headline unemployment rate fell to 5.8% from 5.9% in October, easily beating analyst’s expectations that the unemployment rate would rise to 6.0%.
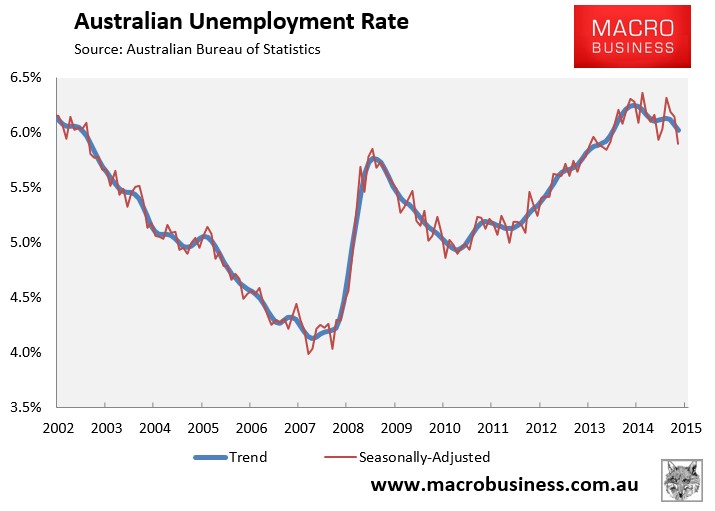
In trend terms, the unemployment rate fell ever so slightly to 5.97% from 6.02% in October:
Again, total employment apparently boomed by a seasonally adjusted 71,400 to 11,900,600, with full-time employment rising by 41,600 to 8,205,800 and part-time employment increasing by 29,700 to 3,694,800:
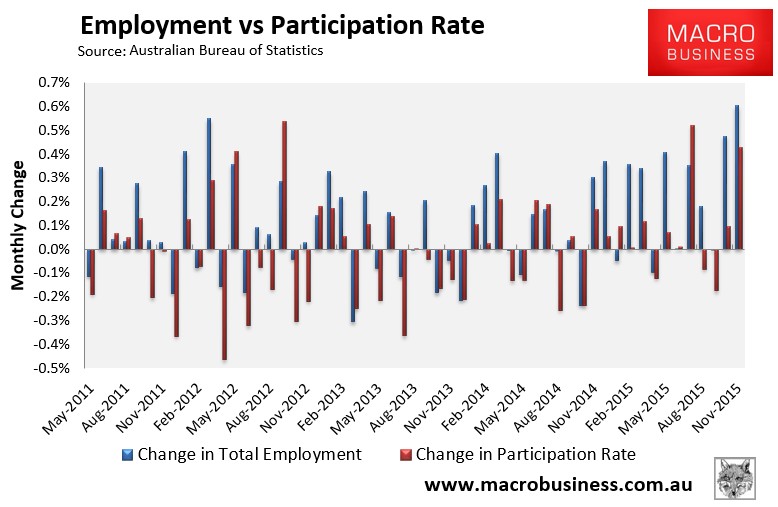
Unemployment would have fallen even further had the participation rate also not risen by 0.3% to 65.3%:
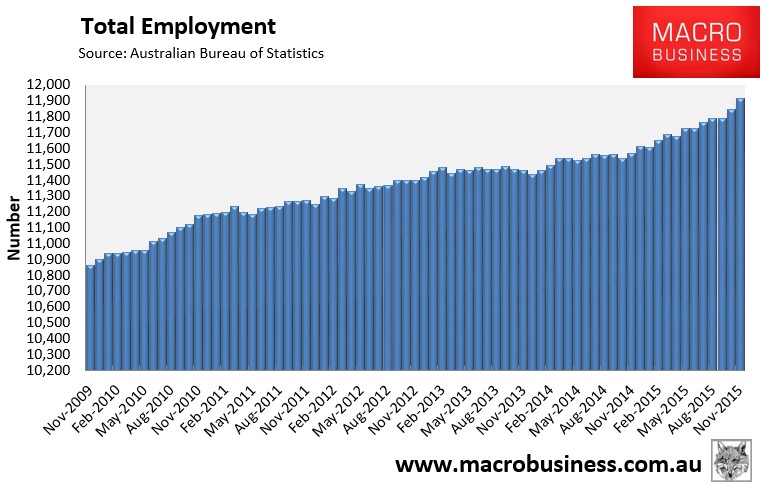
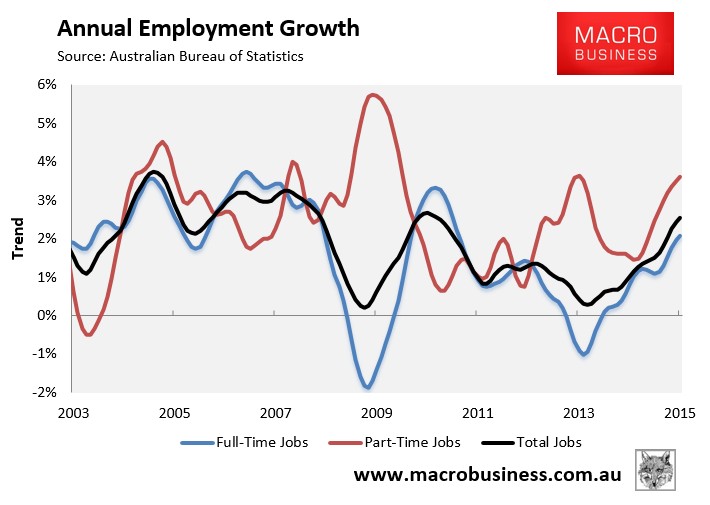
Not surprisingly, the trend in total employment is very strong:
Although, annual employment growth is being driven mostly by part-time employment:
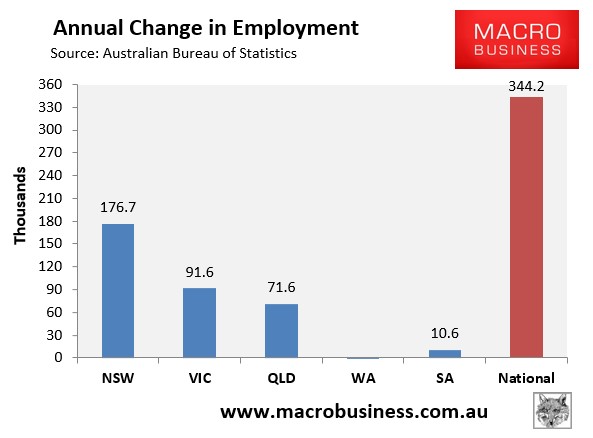
The housing bubble markets of New South Wales (Sydney) and Victoria (Melbourne) continue to drive jobs growth, accounting for 78% of new jobs over the past year in seasonally adjusted terms, whereas Western Australia and South Australia remain depressed (see next chart).
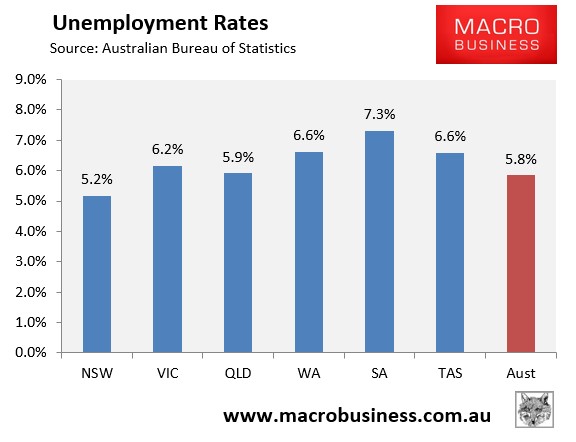
And South Australia and Western Australia have the highest seasonally adjusted unemployment (alongside Tasmania), whereas the bubble epicentre of New South Wales (Sydney) has by far the lowest unemployment (see next chart).
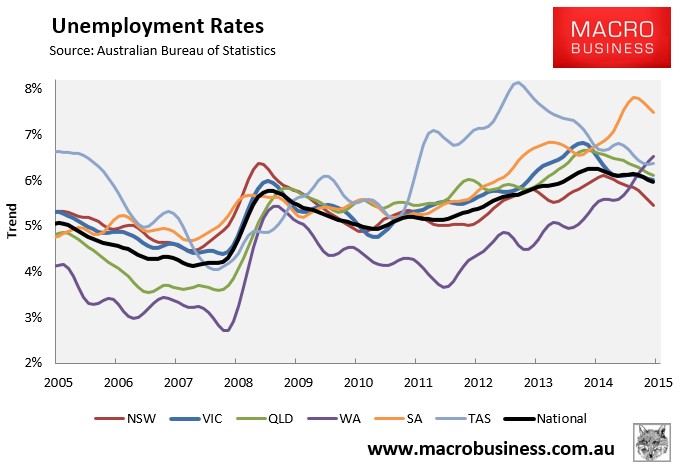
The state seasonally-adjusted figures are notoriously volatile and subject to a big margin of error. As such, the below chart shows the ABS’ trend unemployment rates, which shows the housing bubble markets of New South Wales and Victoria with the lowest unemployment, Western Australia and South Australia with the highest, and Tasmania and Queensland with above-average unemployment but improving trends:
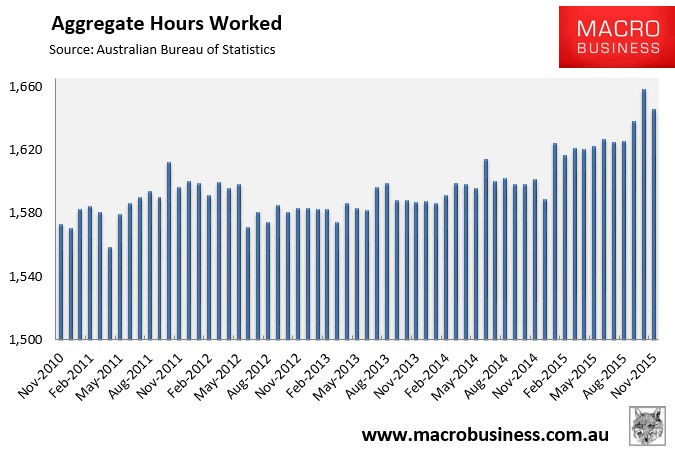
Another reason why the strong jobs figures look suspect is because the aggregate number of hours worked fell sharply in seasonally adjusted terms in November (down 12.7 million hours or 0.8%). However, hours worked have risen by 2.8% over the past year, which is still well above the growth in the population:
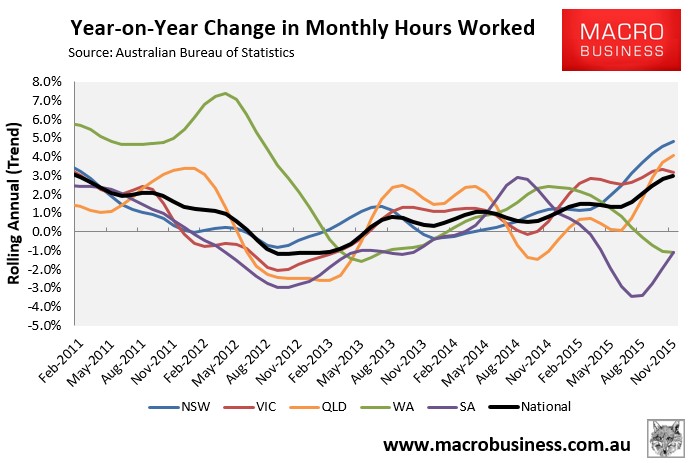
The below chart, which tracks the changes in hours worked on a trend basis, shows that the housing bubble epicentre of New South Wales (Sydney) has driven a large share of the growth, with Victoria and Queensland also experiencing a decent uplift. By contrast, South Australia and Western Australia are in the gutter:
The quarterly underemployment data showed a moderate improvement nationally, but sharply diverging trends at the state level:
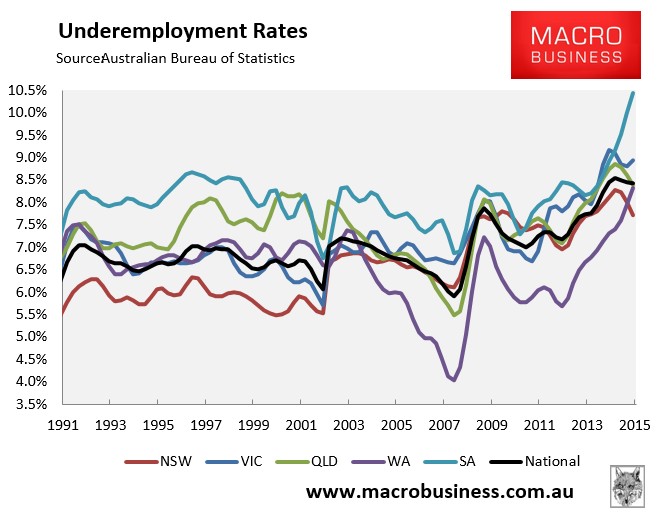
As shown above, underemployment has fallen sharply in New South Wales and Queensland, but is surging in both South Australia and Western Australia.
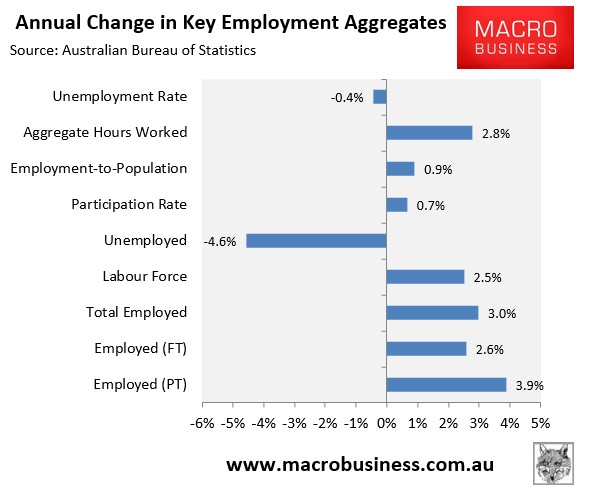
Finally, to round things out, the next chart summarises the annual change in the key employment aggregates on a seasonally-adjusted basis, which shows the strong improvement over the year:
Clearly the ABN’s labour force data is dodgy: there is simply no way that jobs have grown at their fastest pace in 28 years over the past two months.
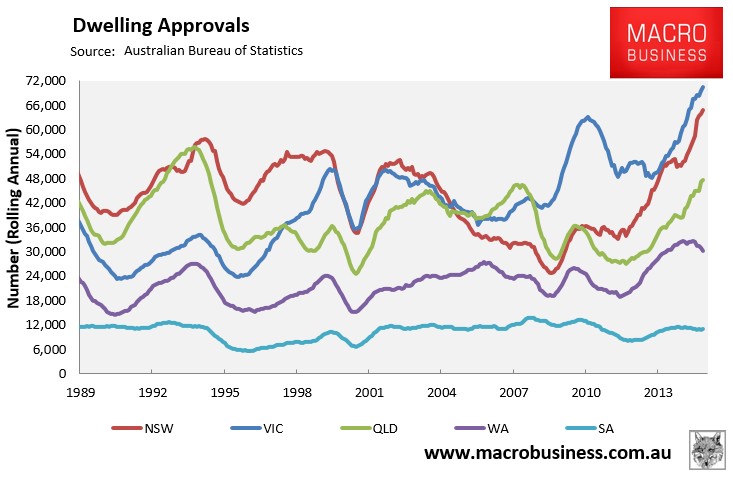
Nevertheless, I stick to the trend anyway and in that regard what is abundantly clear is that the rebound in the Australian labour market has been driven to a large degree by the house price bubbles in Sydney and Melbourne, and the associated surge in construction and consumption that has followed, along with the dwelling construction boom in Brisbane (see next chart).
This jobs momentum will likely continue into early 2016.
The problem is that dwelling approvals peaked in March 2015, which points to a downturn in dwelling construction from Q2 2016. Heat is also coming out of Sydney/Melbourne house price growth with the real prospect of price falls in both markets by mid-2016.
With this housing downturn will come jobs losses, which will also occur alongside crashing mining investment and the closure of the car assembly industry from October 2016 (Ford) into 2017 (Holden and Toyota).
In short, we should enjoy the bubble-induced employment uplift while we can because it won’t last.
unconventionaleconomist@hotmail.com
