
Cross-posted from Martin North.
Westpac Group today announced statutory net profit for the 12 months to 30 September 2015 of $8,012 million, up 6% over the prior year. The Group benefited from some one-off items, stable NIM, but lower non-interest income whilst credit quality improved. The the real challenge is finding future growth, in an environment where mortgage lending growth is likely to slow.
There were a number of significant infrequent items that in aggregate increased net profit. These included the partial sale of the Group’s shareholding in BT Investment Management Limited (BTIM) which generated an after tax gain of $665 million, several tax recoveries of $121 million, partially offset by higher technology expenses of $354 million (post-tax) following changes to accounting for technology investment spending and derivative valuation methodologies changes which resulted in an $85 million (post-tax) charge.
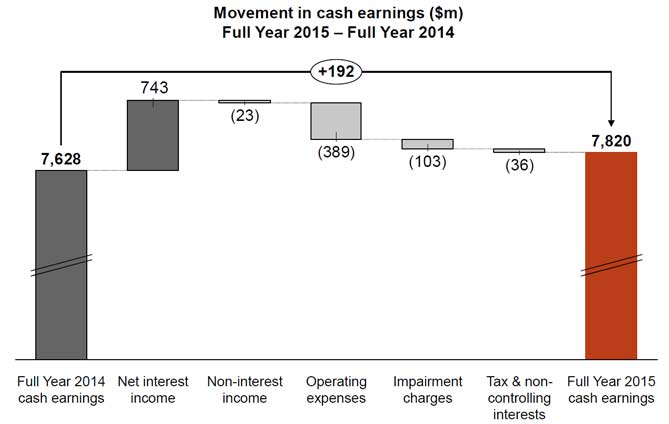
Net interest income of $14,239 million was up 6%, with net interest margin unchanged. It increased $725 million or 5% compared to Full Year 2014, with total loan growth of 7% and customer deposit growth of 4%. Net interest margin was stable at 2.09%, with lower Treasury income, reduced asset spreads and higher liquidity costs offset by reduced cost of funds from both deposit products and wholesale funding.
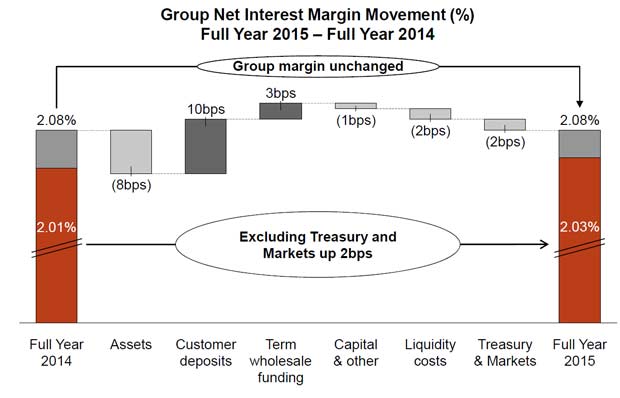 There was an 8 basis points decrease from asset spreads. The primary driver was increased competition in mortgages, with business, institutional and unsecured lending spreads also lower, offset by a 10 basis points benefit from customer deposit impacts, mostly from improved spreads on term deposits and savings accounts. Treasury and Markets contribution to the Group net interest margin decreased 2 basis points reflecting lower returns from the management of the liquids portfolio and balance sheet management in Treasury.
Non-interest income increased $980 million or 15% compared to Full Year 2014 primarily due to the gain associated with the sale of BTIM shares ($1,036 million). Excluding this item, non-interest income reduced $56 million or 1%, from lower trading income and lower insurance income reflecting higher insurance claims predominantly associated with severe weather events. Fees and commissions decreased $14 million, or 1%. Growth in business lending line fees and institutional fees were offset by seasonally lower Australian credit card point redemption income and promotional credit card point awards related to the launch of the Westpac New Zealand Airpoints loyalty program.
Operating expenses increased $926 million or 11% compared to Full Year 2014. This included $505 million related to changes to accounting for technology investment spending. Excluding this item, operating expenses increased $421 million or 5% primarily due to higher investment related costs, including increased software amortisation and foreign currency translation impacts.
Cash earnings of $7,820 million, up 3%, and cash return on equity (ROE) of 15.8%, down 57 basis points. Australian retail and business banking has been the key driver of performance, with Westpac RBB increasing cash earnings by 8% and St. George up by 7%. The New Zealand division also reported a 6% increase in cash earnings (in NZ$).
 The Board increased the final dividend by 1 cps to 94 cps (compared to the interim 2015 dividend). This takes the total dividends for the year to 187cps, up 3% and represents a payout ratio of 75% of cash earnings.
Asset quality improved over the year with stressed exposures to total committed exposures falling 25bps reducing from 1.24% to 0.99%, while impairment charges rose 16%, at 12 basis points or $103 million compared to Full Year 2014. Direct write-offs were also higher. Total impairment provisions were $3,332 million with individually assessed provisions of $669 million and collectively assessed provisions of $2,663 million.
In the consumer sector, unsecured consumer delinquencies trended higher over Full Year 2015 as unemployment increased. Group consumer unsecured 90+ day delinquencies increased 8 basis points since 30 September 2014, but have fallen 10 basis points since 31 March 2015 (typically delinquencies fall in the second half of the year). In New Zealand delinquencies reduced further in Second Half 2015 to be 20 basis points lower than at 30 September 2014.
Australian 90+ day mortgage delinquencies were at 0.45% at 30 September 2015, 2 basis points lower than 30 September 2014 and 31 March 2015, as the portfolio continues to be supported by a strong property market and falling interest rates. The investment property segment has a 90+ day delinquency rate of 0.31% which is lower than the portfolio average. Despite low delinquencies, the modest pace of economic growth and rising
unemployment has led to some increase in delinquencies in those states and regions closest to mining and where there has been a structural shift in manufacturing. This is being offset by robust conditions in NSW where economic activity has been stronger.
Australian properties in possession decreased by 8 over Second Half 2015 to 255. Realised mortgage losses were $70 million for Full Year 2015, equivalent to 2 basis points of Australian housing loan balances.
New Zealand mortgage 90+ day delinquencies improved 7 basis points since 30 September 2014 to 0.14% at 30 September 2015. The low level of delinquencies reflects the improving economy and the strong Auckland housing market.
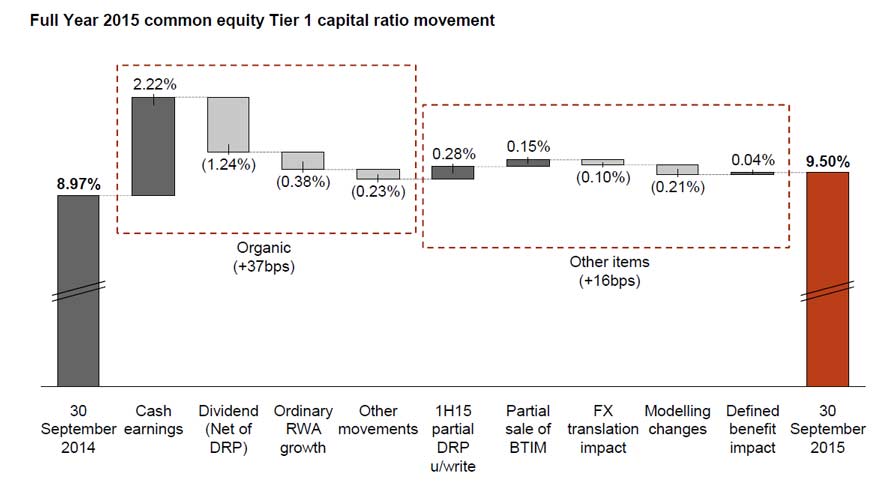
Westpac first raised around $2.0 billion in capital at its First Half 2015 results by partially underwriting the DRP. Capital was further increased by $0.5 billion following the partial sale of shares in BTIM. These two actions added $2.5 billion to the Group’s capital base and contributed to lifting Westpac’s CET1 capital ratio at 30 September 2015 to 9.5%, above the Group’s preferred range of 8.75% – 9.25%.
 Allowing for the approximately $3.5 billion of ordinary equity expected to be raised through its recent renounceable entitlement offer, Westpac will be well within the top quartile of banks globally with a CET1 ratio of over 14% on an internationally comparable measure.
Looking at the segmentals, Westpac RBB’s focus on service and having Australia’s leading mobile/online capability for customers helped deliver both core and cash earnings growth of 8%. Record customer growth of over 191,000 helped drive loan and deposit growth up 6% and 7% respectively.
St. George Banking Group’s brands, St. George, BankSA, Bank of Melbourne and RAMS contributed to the 7% increase in cash earnings, with core earnings rising 8%. The Bank of Melbourne opened its 100th branch during the year and was voted best regional bank in Australia for the second time2. Revenue increased 7% with net interest income up 7% due to 8% growth in lending and a 3% rise in deposits.
BT Financial Group continues to be the leading wealth provider in Australia, ranking number 1 on all Platforms, with Funds under Administration (FUA) share of 19.9%. BTFG delivered flat cash earnings over the year with the result impacted by the partial sale of BTIM, lower performance fees, and higher insurance claims.
Westpac Institutional Bank is the number one institutional banking franchise in Australia. Financial conditions have been challenging, with margins 15 basis points lower in line with global capital market conditions. This contributed to a 12% reduction in cash earnings to $1,286 million. The decline was also due to methodology changes to derivative valuations (which reduced revenue by $122 million) and a lower impairment benefit. The business continued to achieve good underlying growth, with lending up 12% and customer revenue up 2%.
Westpac New Zealand delivered another solid result with a 7% increase in core earnings and a 6% increase in cash earnings (9% and 8% respectively in A$). The result was supported by revenue growth of 7% and good balance sheet growth, with a 7% rise in lending and a 5% increase in deposits.
Following changes to the Group’s technology and digital strategy, rapid changes in technology and evolving regulatory requirements, a number of accounting changes have been introduced, including moving to an accelerated amortisation methodology for most existing assets with a useful life of greater than three years, writing off the capitalised cost of regulatory program assets where the regulatory requirements have changed, and directly expensing more project costs. The expense recognised this year to reduce the carrying value of impacted assets has been treated as a cash earnings adjustment given its size and that it does not reflect ongoing operations.
