Some excellent work here from Justin Smirk at Westpac:
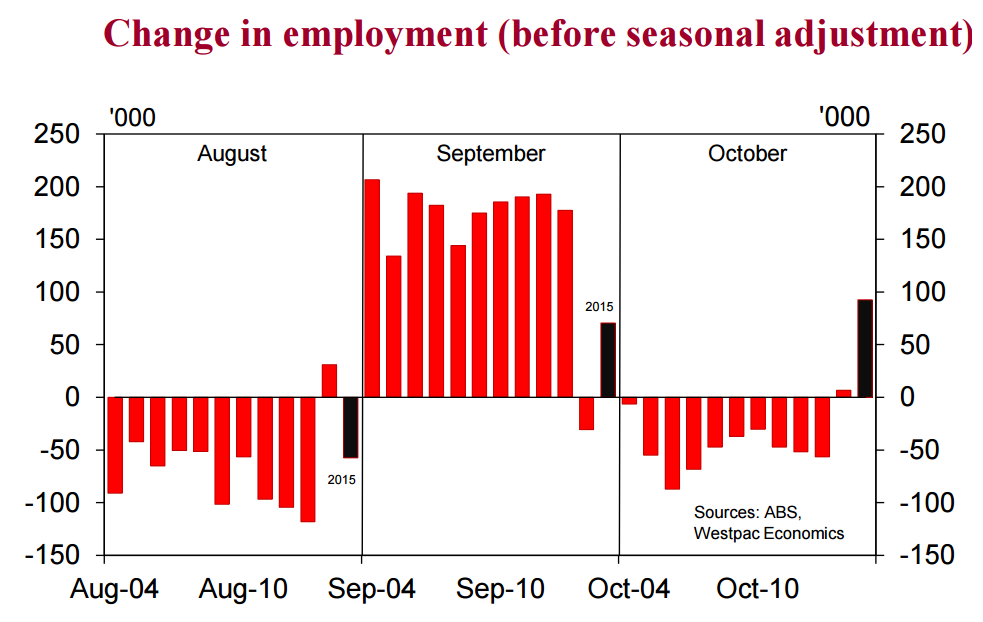
The employment data in original terms continues to behave in a very odd manner…
The ABS changed the supplementary surveys that are conducted as part of the February and August Labour Force surveys. Readers will remember the volatility in the data from the August 2014 survey and how it has since been revised away. However, what has not been revised away is the volatility in the underlying original data. In the chart opposite, you can see that prior to 2014 there was a significant August fall in original terms which was followed by a significant rebound in September then a meaningful negative in October. In 2014, with changes to the supplementary surveys, the original August data printed a modest rise while the September survey reported a modest fall and October printed a small rise.
In 2015, August returned to being a negative and September reverted to a positive though both are of a smaller magnitude than the psat (particularly the September rise). But more surprising was the 92.7k rise in original employment this October, something that is unprecedented in the data. In fact excluding 2014 you have to go all the way back to October 1979 to find a rise in original terms and even then it was a very modest +6.3k. Something significant has changed in the underlying data in October 2015.
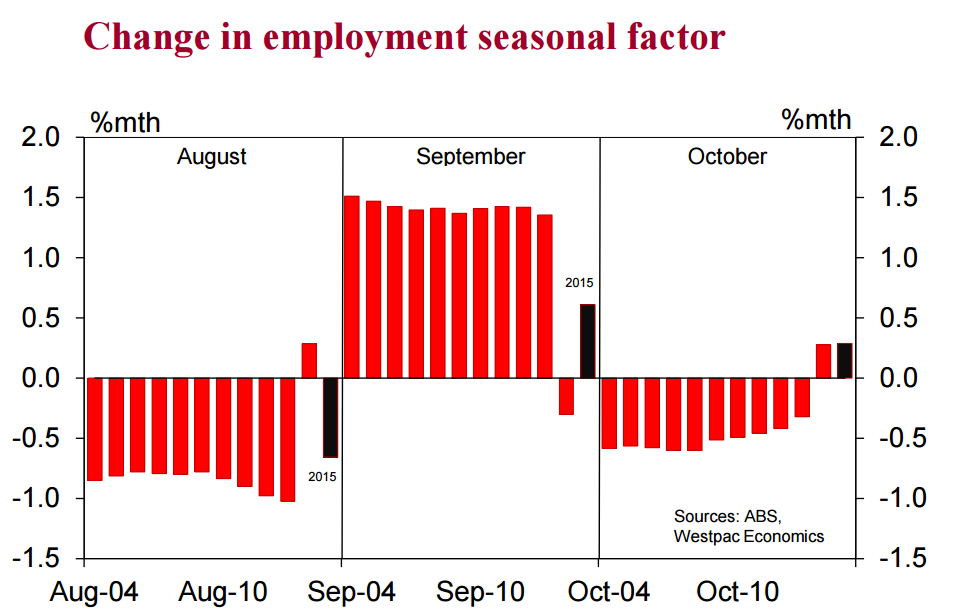
…and yet in October the ABS used the same seasonal factor it estimated last year.
If you then compare the monthly change in the seasonal factors, you can see that the ABS did modify the seasonal adjustment process to account for this. Historically the seasonal factors suggest a seasonal impact of around –1.0% in August, almost +1.5% in September, and –0.5% in October. However, in 2014 the seasonal factor was just +0.3% in August, then –0.3% in September. This year, the factors have been reversed with a –0.6% fall in August and a 0.6% rise in September
But there is something very odd in the October employment seasonal adjustment process. In 2012 the change in the October seasonal factor was –0.4%, –0.3% in 2013 then +0.3% in 2014 and it was +0.3% again in 2015. As such, the seasonal factor was a very modest offset for what is a very significant underlying rise.
Normally you have to have to wait 3 to 5 years for the seasonal factors to settle down before you can estimate such significant swings in the seasonal adjustment process. Clearly the ABS is taking other factors (such as estimates of the impact of changing the supplementary surveys) into the seasonal adjustment process in August and September but has been less inclined to do so for October.
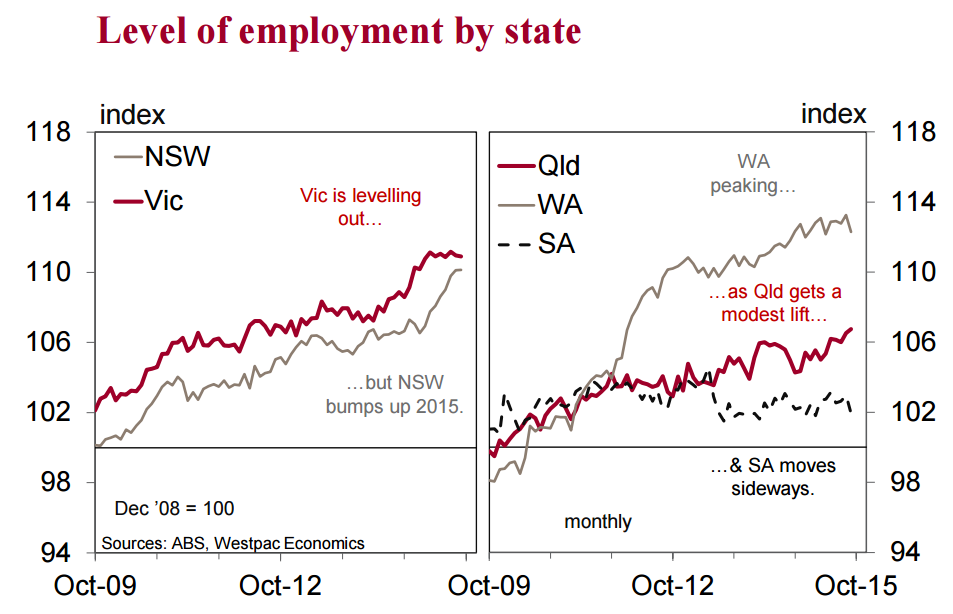
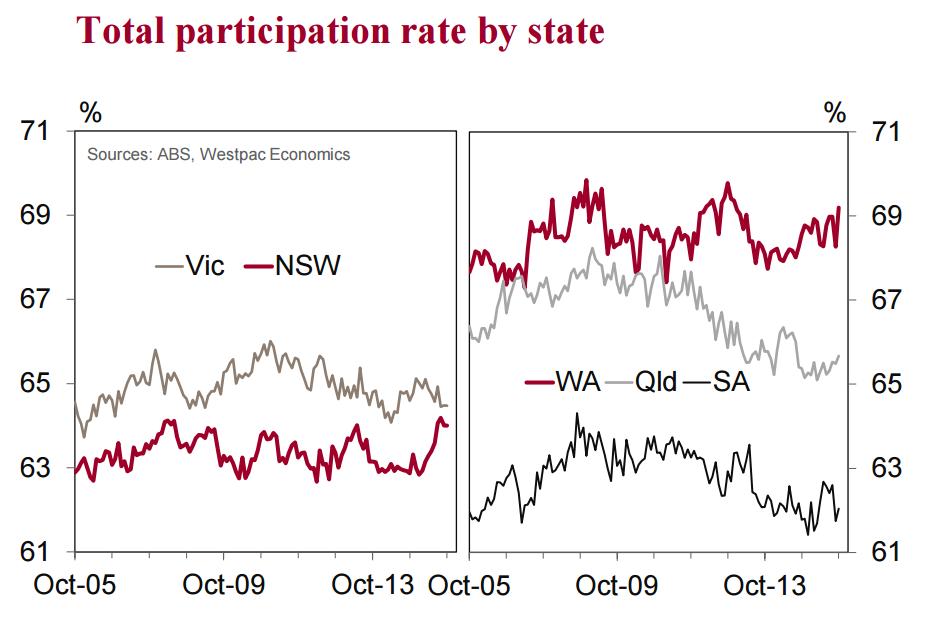
The state data also highlighted something very odd
Diving into the state data a very interesting anomaly emerges. Robust employment outcomes for NSW (+18.7k) and Vic (26.1k) are not surprising given those states’ more timely activity indictors are quite sound. And given those more robust employment outcomes the decline in unemployment, to 5.5% from 5.8% in NSW and 5.6% from 6.3% in Vic, make sense. We are a little surprised by the 12.1k rise in Qld however, even though the unemployment rate fell in the month at 6.2% it is still above the national average which is what you would expect given the unwinding of a large resources investment boom.
The real eye opener was, however, in WA. It is true that the rise in the unemployment rate to 6.4% (above the national average) from 6.1% is consistent with the unwinding of the resources investment boom in that state. But what was unexpected, and somewhat unexplainable, is that this rise in unemployment was associated with a 14.8k gain in employment most of which came from a rise in female employment (13.2k). Such a dominate rise in female part-time employment in one month is quite hard to explain and suggests that something unusual is going on in the survey.
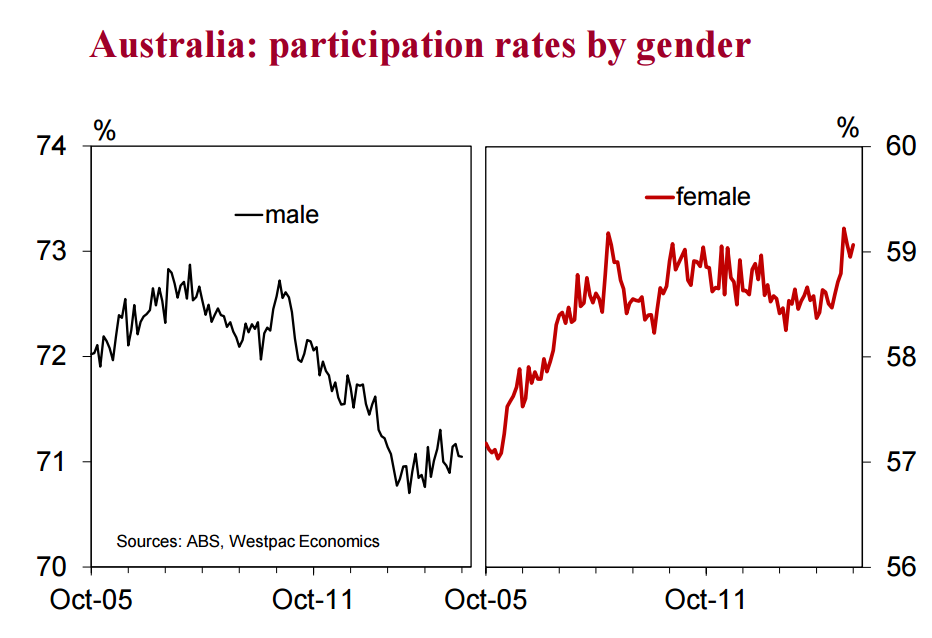
Further confirmation on a structural change to participation…
Throughout July and August, the Federal Government was phasing in new rules for unemployment benefits (Newstart). Benefits are now harder to get without actually applying for employment. In July, the proportion of Newstart recipients actively looking for work jumped 9% while the number of Newstart recipients fell a touch. Because more Newstart recipients were actively looking for work, rather than merely being available for work, this potentially could have led to a rise in the labour force and hence a gain in participation.
…but the impact was not uniform across the country…
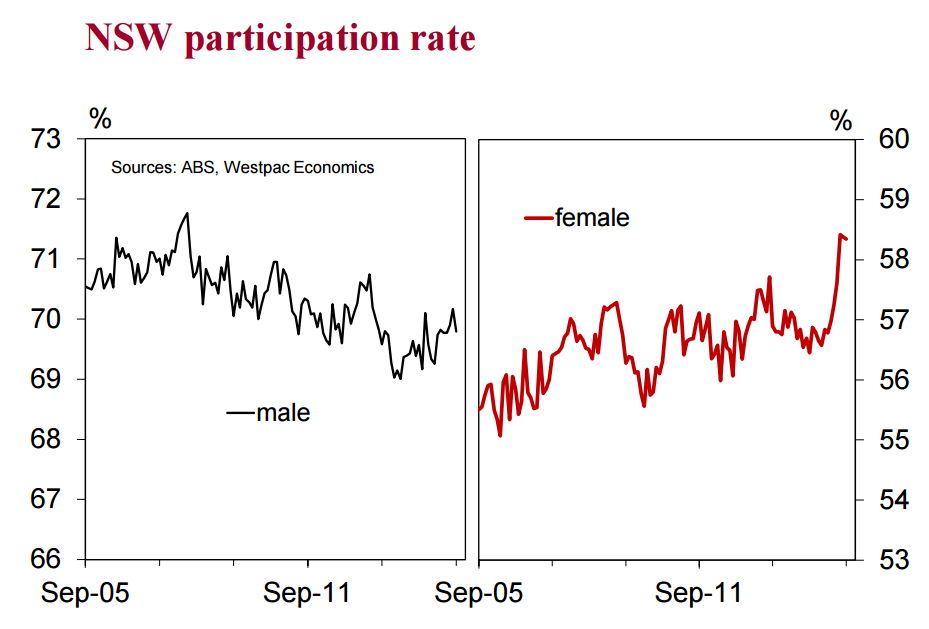
As we have noted before, just about all of the July gains in participation were in NSW and in particular via a large surge in female participation. To us, something is not right when all of the rise in employment comes from one state, is associated with one gender, and is combined with an outsized rise in participation.
…and the data suggests something more structural is underway.
The August, September and now October surveys do provide some support to the idea that changes to Newstart boosted participation. In July, we would not have seen the full impact of the Newstart changes as they were being phased meaning August would also be effected. The fact that the participation rate fell 0.1ppt in August and a further 0.1ppt in September suggests there was a small amount of statistical noise in the initial rise. However, in October participation lifted to 65.0% and is now well up on the October 2014 low of 64.5% and holding a new rising trend. In addition, we are yet to see any correction to the July surge in female participation in NSW. The July print of 58.4% was a record high for this series while it has only eased back to 58.2% in October. It was 56.6% in January 2015.
Part-time employment is outperforming again.
Total employment has grown 315k (or 2.7%yr) in the year to October. Full-time employment grew 167.1k (2.1%yr) while parttime is still outperforming (in a growth pace sense) with a 148k (4.2%yr) gain. We have been hoping to see a shift back towards fulltime employment but this has not been so as the October average monthly gain in the previous three months was 13.9k for full-time and 12.0k for part-time.
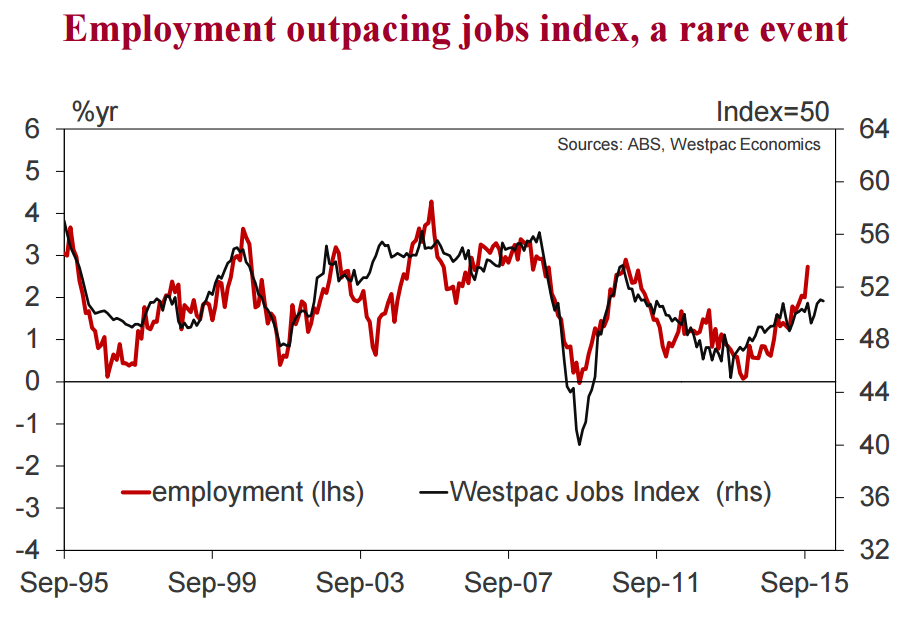
Outlook
Westpac’s Jobs Indicator, which is composite of the employment questions in various business surveys, suggests that employment growth through to the end of the year should be around, or just under, 2%yr. The current pace of 2.7% looks to be one of those relatively rare cases where the ABS employment numbers exceed the business surveys. In most prior cases of this, the pace of employment growth in the ABS survey eased back to match the business surveys. We have also assumed that while some volatility in the participation rate is likely going forward, without a new kick from the ageing population or a change in government benefits policy, the participation rate is likely to oscillate around that level. However, if the participation rate continues to drift higher in a meaningful way, the unemployment rate could be quite sticky around current levels.
In short, ABS numberwang is getting worse not better.
David Llewellyn-Smith is Chief Strategist at the MB Fund and MB Super. David is the founding publisher and editor of MacroBusiness and was the founding publisher and global economy editor of The Diplomat, the Asia Pacific’s leading geo-politics and economics portal.
He is also a former gold trader and economic commentator at The Sydney Morning Herald, The Age, the ABC and Business Spectator. He is the co-author of The Great Crash of 2008 with Ross Garnaut and was the editor of the second Garnaut Climate Change Review.