
Cross-posted from Martin North.
Following on from the APRA data released yesterday, today we look at the bank loan portfolio movements. Looking at home loans first, the APRA credit aggregates which focus on the ADI’s shows that the stock of home loans was $1.378 trillion, up from $1.367 trillion in July, or 0.8%. Within that, investment loans fell from $539.5 bn to $535.5 bn, down 0.7%, whilst owner occupied loans rose from $827 bn to $843 bn, up 1.9%, thanks to the ongoing reclassification. We see some significant portfolio re-balancing at Westpac between owner occupied and investment loans, continuing a trend we observed last month. We also see a relatively strong movement in owner occupied loans, as we predicted, as the focus shifts from investment lending to owner occupied loans.
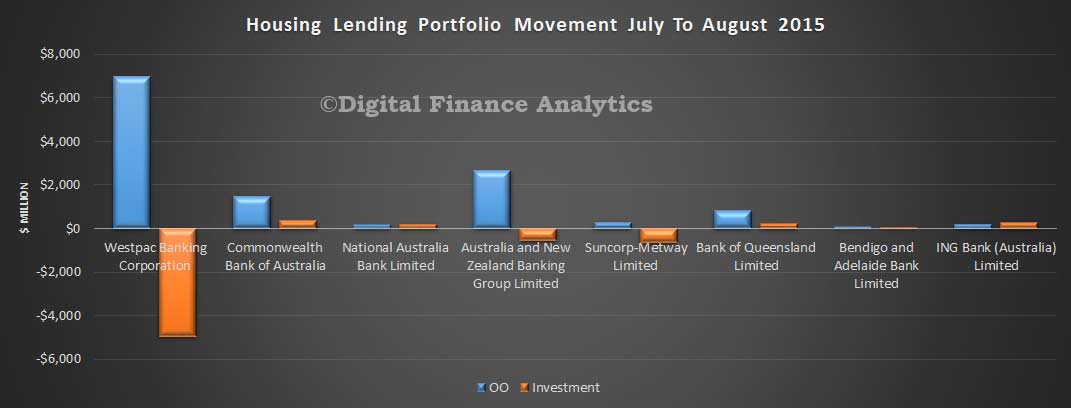
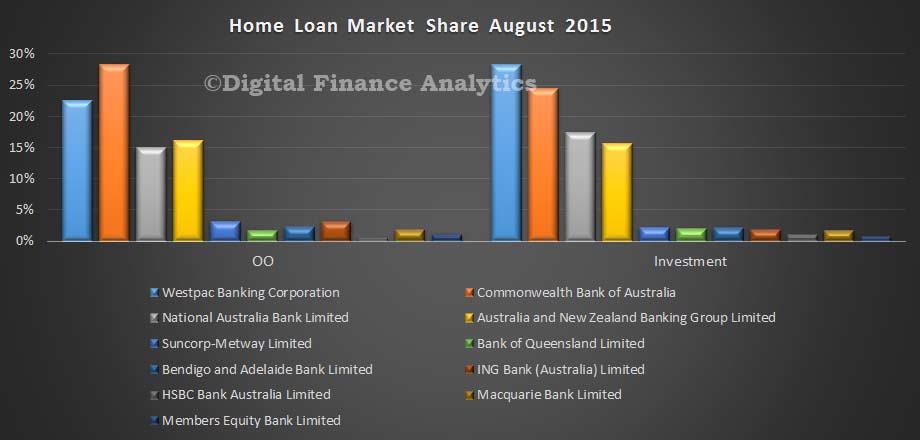
The relative portfolio shares have not changed that much, but the consequences of the Westpac moves means their relative share of investment lending is down somewhat from 28.9% to 28.2% of the market, whilst CBA moved from 24.2% to 24.4% and NAB from 17.3% to 17.4%.
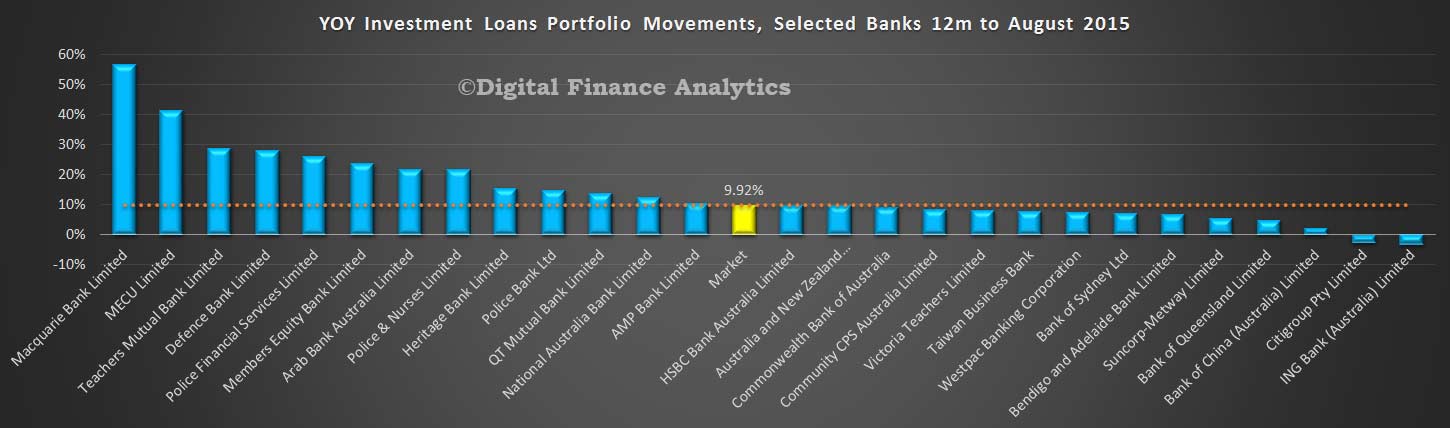
Looking at trend portfolio movements (which we calculate by summing the monthly movements from September 2014 to August 2015 using the APRA data, adjusted for the ANZ and NAB revisions which were announced earlier), the annual market growth for investment loans is 10%, in line with the APRA speed limit, and we see some banks above. We expect to see further revisions as we progress.
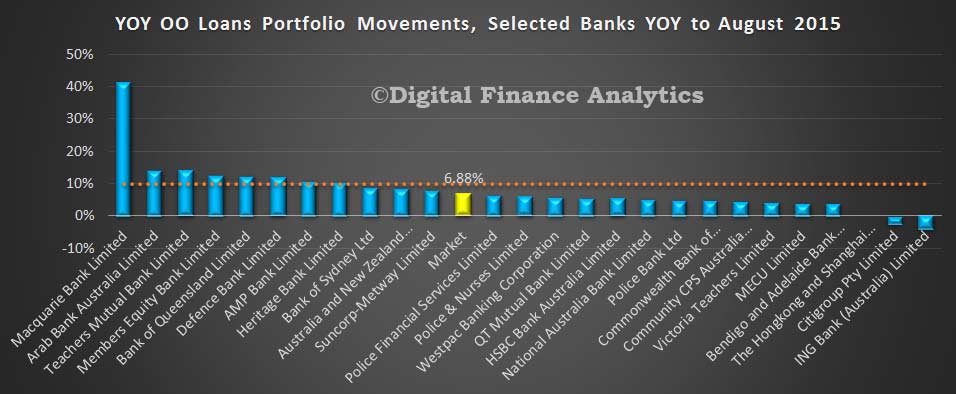
Looking at the owner occupied side of the ledger, average portfolio growth was 6.88%, and again we see a fair spread with some well above the 10% mark – though of course there is as yet no speed limit on owner occupied lending.
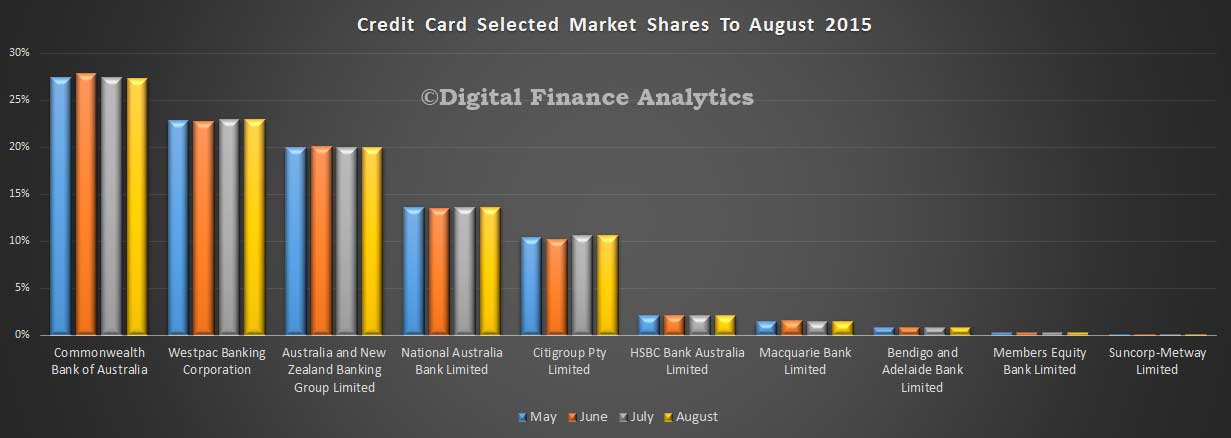
Turning to credit cards, the $40.8 bn portfolio of loans hardly changed in the month of August, so the mix between providers showed no noticeable movement.
Finally, looking at deposits, there were small portfolio movements, with overall balances rising 0.6% to $1.87 trillion.
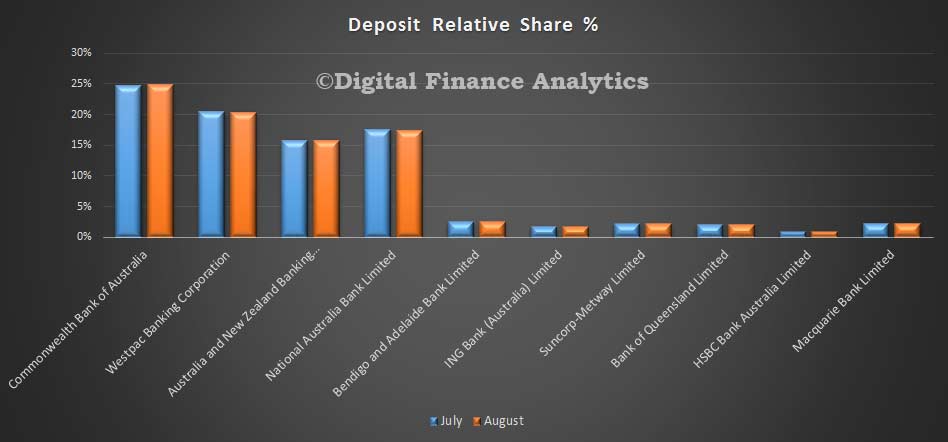
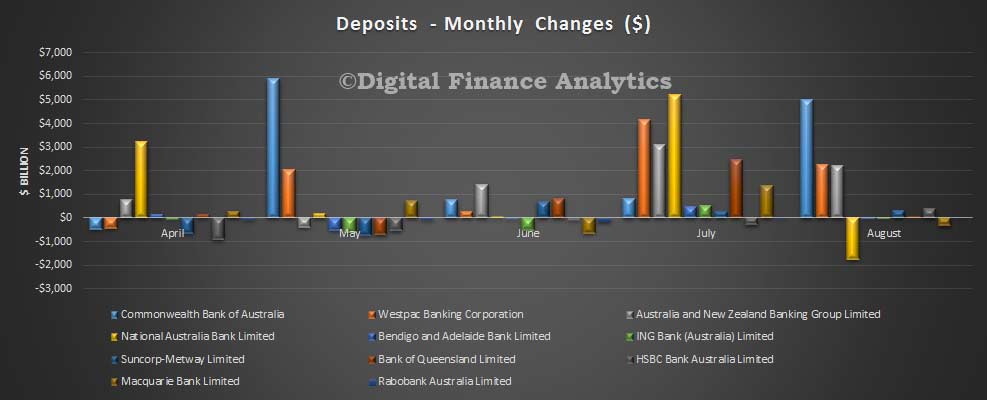
Looking at the banks, in dollar terms, NAB lost a little share, whilst CBA outperformed with an increase of $5bn in deposits. The noise in the data needs to be recognised, however, because in July, the position was somewhat reversed.
We also note APRA published a paper on revisions to the ADI data, APRA’s analysis shows that, in the 24 editions of MBS from January 2013 to December 2014:
- There were 82 reporting banks, an average 2,148 new data items published in each edition of MBS, for a two year total of 51,553 data items.
- there were 1,951 revisions to data items (an average of 81 data items revised per edition). There is approximately a 4.6 per cent likelihood of any data item being revised within a year from its first publication;
- on average, six banks (around nine per cent of all banks) resubmitted data per month that resulted in revisions to MBS;
- there were 557 revisions (about 29 per cent of all revisions, or 1.0 per cent of all data items) over 10 per cent and more than $100m of the original value (‘significant revisions’); and
- revisions to data items relating to the loans-to and deposits-from non-financial corporations were the two most significantly revised data items, together accounting for 20 per cent of all ‘significant revisions’, between January 2013 and December 2014.
Following analysis of MBS revisions, APRA intends to improve the usefulness of MBS by individually listing revisions of more than five per cent and $5m of the original value in future editions of MBS.
APRA publishes revisions to its statistics to improve the usefulness of its publications. APRA publishes revised statistics when better source data becomes available or occasionally, after a compilation error has been identified. Better source data typically becomes available from resubmissions of data by reporting institutions. APRA lists ‘significant revisions’ to statistics and aims to explain the circumstances under which they were revised. Significant revisions currently include those revisions more than $100 million and over 10 per cent of the original value. These significant revisions are listed in the ‘revisions’ section of the Back Series of Monthly Banking Statistics publication.
To minimise the frequency of revisions, APRA analyses past revisions to identify potential improvements to source data and compilation techniques. Such analysis is considered international best practice. The International Monetary Fund’s (IMF’s) Data Quality Assessment Framework (DQAF) for example states that statistical agencies should ensure that “studies and analyses of revisions and/or updates are carried out and used internally to inform statistical processes.” The DQAF also recommends that “studies and analyses of revisions are made public.”
Given the substantial revisions we are currently seeing in the 2015 series, especially relating to investment and owner occupied lending, we would expect to see more details of significant changes in the future.
