
As summarised earlier, the Australian Bureau of Statistics (ABS) today released labour force data for the month of June, which registered a small rise in the headline unemployment rate (from a revised 5.9% to 6.0%), with 7,300 jobs added.
The result beat analyst’s expectations, who had expected the unemployment rate to rebound to 6.0%, with zero jobs created.
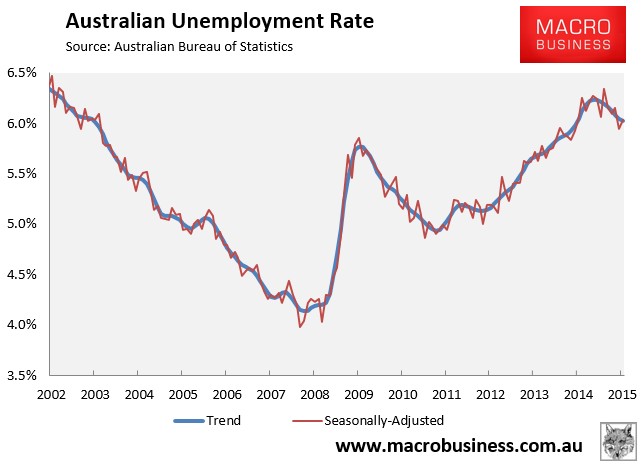
In trend terms, the unemployment rate remained basically flat at 6.0%:
Total employment rose a seasonally adjusted 7,300 to 11,768,600, with full-time employment increasing 24,500 to 8,156,200 and part-time employment decreasing 17,200 to 3,612,400.
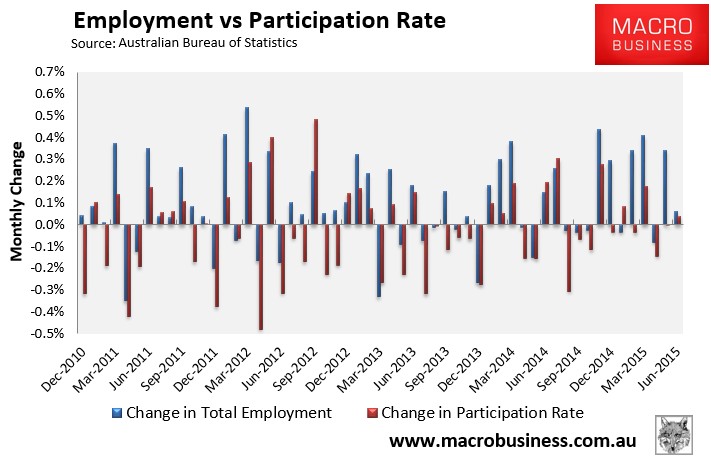
Meanwhile, the Participation rate increased by less than 0.1% to 64.8%.
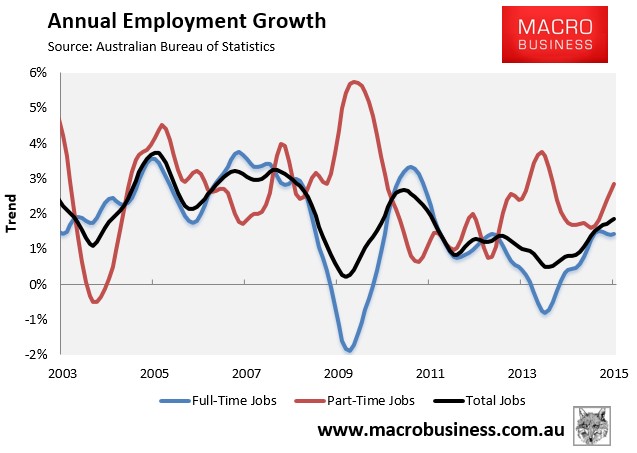
The trend in total employment has improved since October 2014, even though it flattened this month (see next chart).
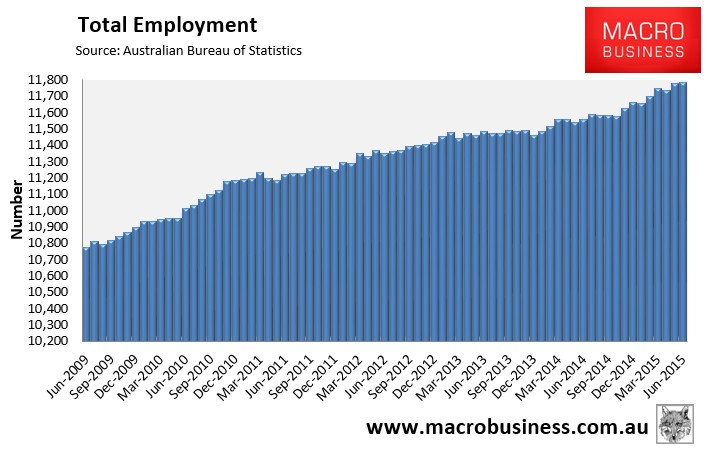
Although, the trend in full-time jobs growth (1.7% seasonally adjusted, 1.4% trend) is weakening once more, despite this month’s growth (see next chart).
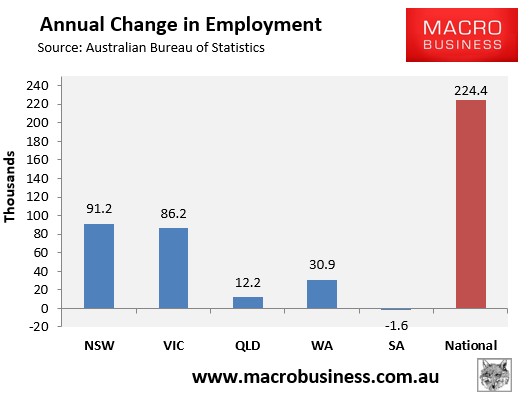
The housing bubble epicentres of New South Wales (Sydney) and Victoria (Melbourne) have driven jobs growth over the past year in seasonally adjusted terms (see next chart).
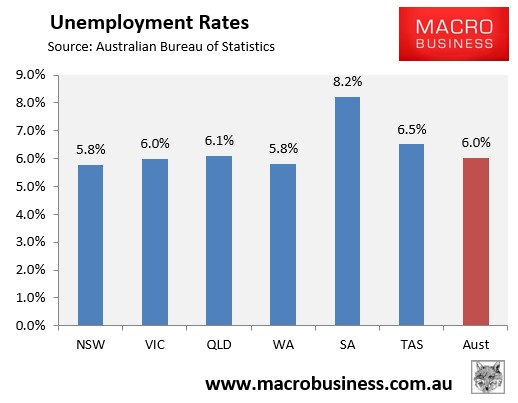
And South Australia and Tasmania now have the highest seasonally adjusted unemployment, whereas Western Australia and New South Wales have the lowest (see next chart).
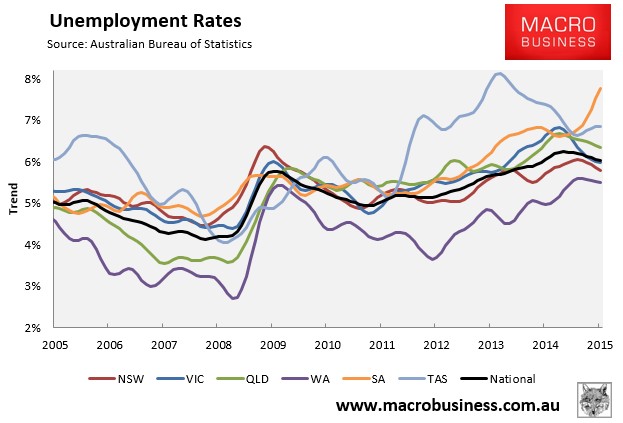
The state seasonally-adjusted figures are notoriously volatile and subject to a big margin of error. As such, the below chart shows the ABS’ trend unemployment rates, which shows Western Australia with the lowest unemployment (and still falling), South Australia, Tasmania and Queensland with the highest (but with diverging trends), and Victoria’s and New South Wale’s improving:
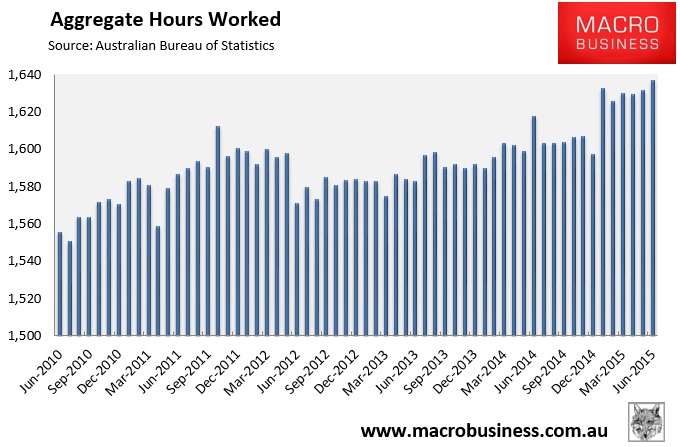
Aggregate number of hours worked rose in seasonally adjusted terms in June (up 5.1 million hours or 0.3%), although it has been fairly flat for six months. Hours worked have also risen by 1.2% over the past year, which is slightly below the growth in the population:
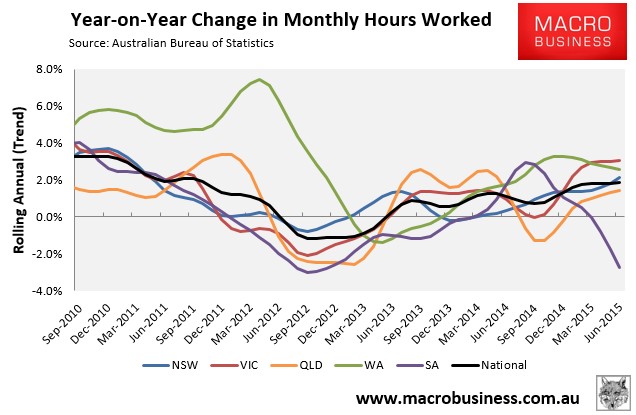
The below chart, which tracks the changes in hours worked on a trend basis, shows a mixed bag across the states and a flat trend nationally (+1.9% YoY):
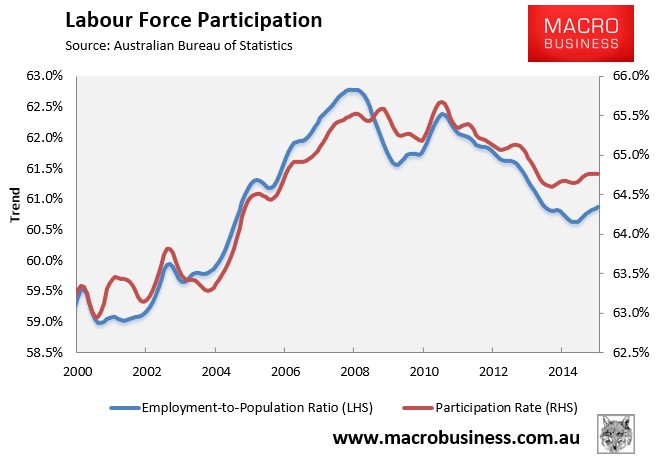
The participation rate continues to recovered, as is the employment-to-population ratio:
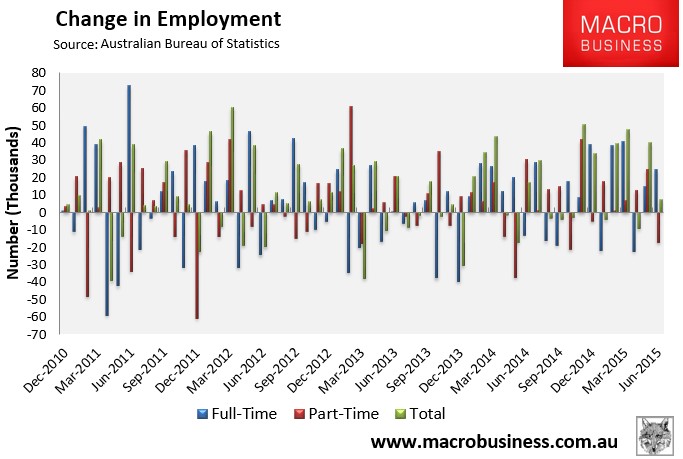
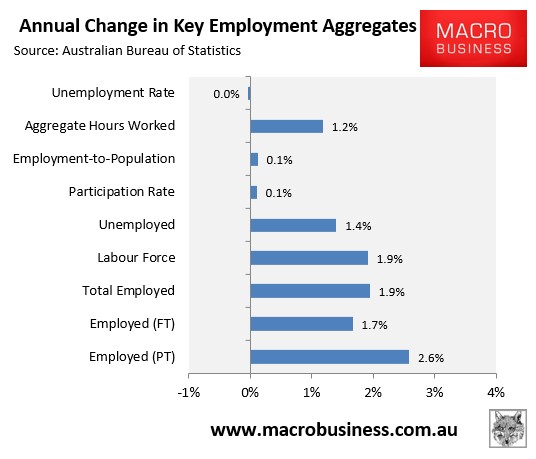
Finally, to round things out, the next chart summarises the annual change in the key employment aggregates on a seasonally-adjusted basis:
Overall, it’s a pretty good report when viewed in isolation, and shows an improving labour market trend from record high dwelling construction and other housing-related industries, brought about by cheap credit and continued strong house price appreciation, which are having a particularly positive impact in New South Wales and Victoria.
However, there are stiff headwinds building that will weigh heavily on employment into the near future, and likely make the recovering short-lived.
Specifically, the housing construction boom is unsustainable and is likely to top-out sometime later this year or early next, just as the unwind of mining investment accelerates and the local car industry shutters.
As argued last month, 2015 was never the problem for Australia’s labour market. It is 2016 and 2017 that are the concern, as the economy faces the triple threat of falling mining-related employment; falling housing-related employment; and falling manufacturing (car industry) employment.
That said, given the current crash in commodity prices and China, along with the ructions in Europe, there is now the risk that the unwind will occur earlier than expected.
unconventionaleconomist@hotmail.com
