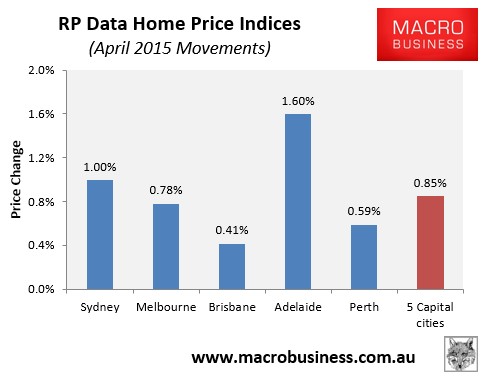
RP Data’s price results are in for April, with the daily index recording a 0.85% rise over the month at the 5-city level, driven again by strong price growth in Sydney, with Adelaide also registering strong growth (see next chart).
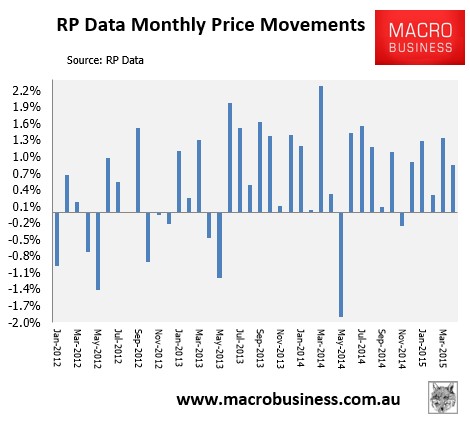
It was the fifth monthly rise in values since the unexpected fall in November, with values also up by 2.50% over the quarter, with Sydney’s up by a whopping 5.36% (see next chart).
While the rate of price growth is trending down in the other major capitals, Sydney’s is rising once more (see next chart).
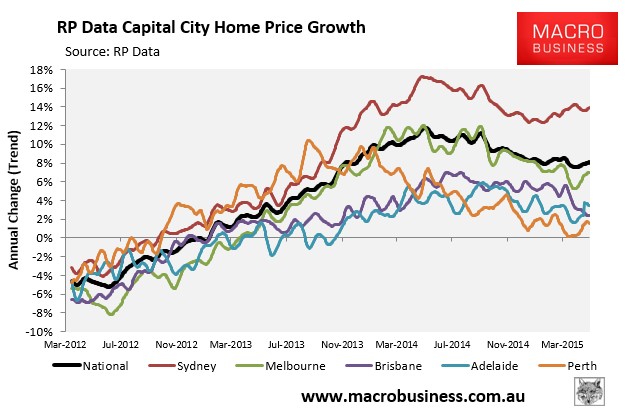
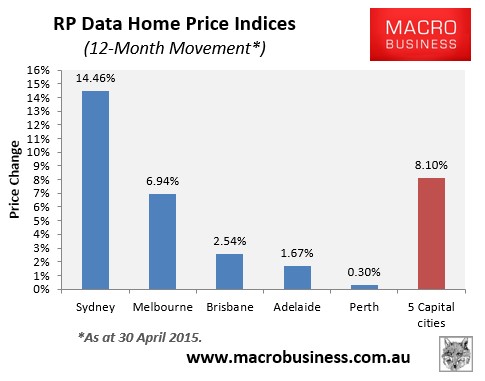
Home values have risen by 8.10% over the past year at the 5-city level, with Sydney’s up an incredible 14.46% (see next chart).
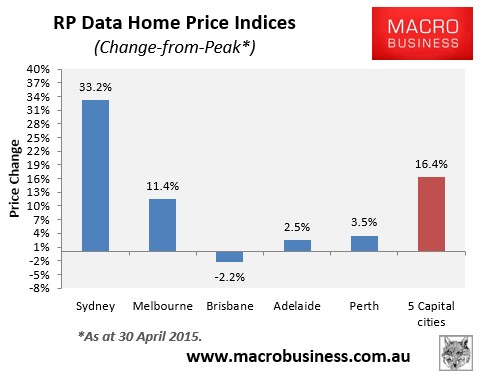
Values are also 16.4% above the October 2010 peak at the 5-city level, with values in all major capitals except Brisbane also above their previous respective peaks, and Sydney’s up by one-third (see next chart).