No Macro Morning today as Chris Becker battens down the hatches in the path of TC Marcia (miner flooding and power outages already and he’s some distance away).
Instead, here’s a useful technical take on the ASX200 breakout from Chris Weston at IG:
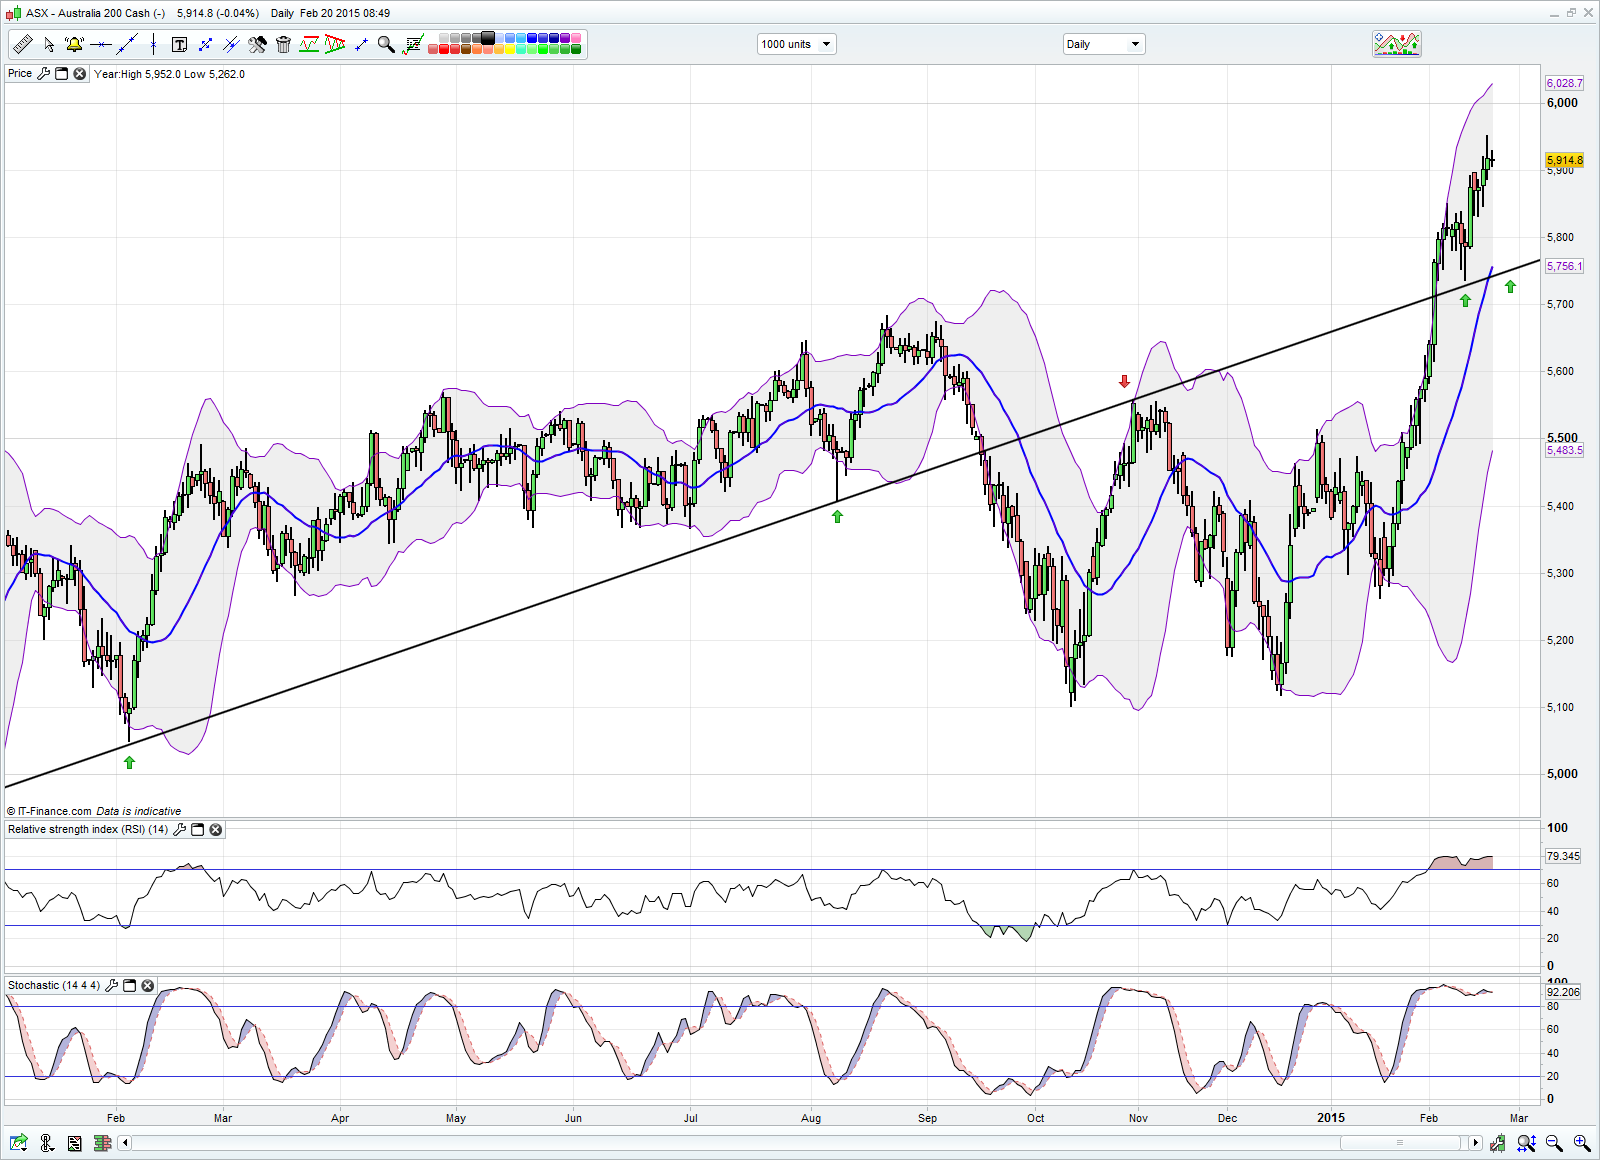
The Australia 200 cash market is trending higher and we can see from stochastic momentum that there is good underlying strength behind the buying.
The daily chart shows good trend support drawn from the February 2014 low (see the attached chart) coming in at 5,740, although we will need to see 3% pullback from current levels to view how the market reacts around this support level.
If history is to our guide, we can see that on 12 February the index fell back to the trend and buyers came back in, suggesting this could feasibly materialise again.
The 14-day RSI (now at 79.42) also suggests we should have a positive directional bias on the index, however the rate of change in price has probably got a bit ahead of itself and suggests the risks of profit taking is high. These co-insides with the market internals which highlights some 84% of stocks are above the 50-day moving average – a level where we traditionally see sellers prevalent.
Looking more closely at price action we can see some indecision coming into the market, but there is no clear sell signal on the daily chart as such. Drilling down into the hourly chart we can see good consolidation in price, but again nothing that provides any strong sell signals yet. The trend is looking tired, although the 20-day moving average is pointing firmly higher suggesting over the next week or so we could see a further move to the upper Bollinger band at 6,028. Still, a pullback would clearly be a positive as it would allow a better entry for funds to put new money to work.
Reporting season is firmly underway and perhaps not providing the market with the earnings supports to give the 650 point rally from the 16 January pivot low real backbone. The index is currently trading on price-to-earnings multiple some 15% above the 10-year average; however this seems to matter little when the ASX 200 commands a 4.5% dividend yield – one of the highest in the developed markets. There is little doubt in my mind that international money is making a home in the Australian market in search of yield.
It’s worth flagging that some 62% of the ASX 200 have reported earnings, with 54% having beaten consensus earnings estimates and aggregated earnings falling 10.4%. The decline in earnings has largely been driven by material sector, which is hardly going to surprise anyone given the falls in the bulks and base metals. From an earnings perspective it is hard to justify a move through 6,000 and would make sense for the index to pullback a touch.
I haven’t really touched on international markets or the increased talk of the vulnerabilities around Australia’s AAA sovereign credit rating, but taking a view on the market from both a technical and fundamental perspective it suggests that the index is in need of consolidation and the risk/reward trade-off is to align strategies with the prevailing trend and current market momentum and use pullbacks as to initiate fresh long positions. The February 2014 uptrend at 5,740 could offer a more compelling entry point for traders who look at daily charts and slightly longer term timeframes (i.e. three to 14 day strategies). As things stand there are no obvious signals to be short on the daily charts.
David Llewellyn-Smith is Chief Strategist at the MB Fund and MB Super. David is the founding publisher and editor of MacroBusiness and was the founding publisher and global economy editor of The Diplomat, the Asia Pacific’s leading geo-politics and economics portal.
He is also a former gold trader and economic commentator at The Sydney Morning Herald, The Age, the ABC and Business Spectator. He is the co-author of The Great Crash of 2008 with Ross Garnaut and was the editor of the second Garnaut Climate Change Review.