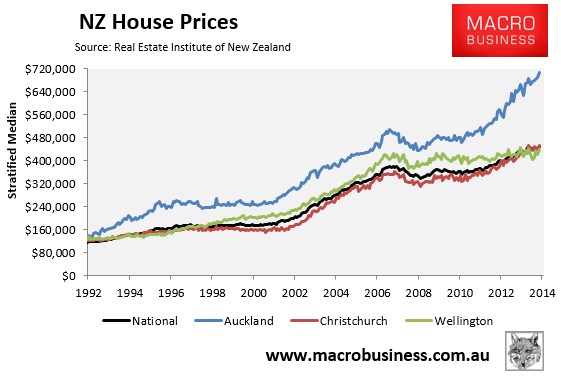
The Real Estate Institute of New Zealand (REINZ) has released its October house price results, which registered a solid monthly rise in values, but another slowing in annual growth.
In the month of October, the national stratified median price rose by 1.4% to nearly $450,000. Prices rose by 2.9% in Auckland, 2.7% in Christchurch and 3.8% in Wellington. Over the quarter, prices rose by 2.7% nationally, with increases recorded in each of the major capitals.
The price changes are shown more clearly in the below chart, which shows the values in index form since 2005:
Annual house price growth slowed to 3.9% nationally in the year to October 2014 to be 18.0% above the November 2007 peak. Prices in New Zealand’s largest city, Auckland, rose by 9.8% in the year to October to be 38.8% above their July 2007 peak. This was followed by New Zealand’s second biggest city, Christchurch, where prices rose by 9.1% over the year to be 24.5% above their 2007 peak. Finally, prices in the capital, Wellington, rose by 2.5% in the year to be 3.4% above the September 2007 peak.
The below chart shows the annual price growth in trend terms (3-month moving average) in order to smooth volatility, with annual price growth clearly weakening:
And the next chart shows growth at the national level only, which paints an even clearer picture:
The overall softening of annual price growth amid the strong domestic economy and rising population growth (immigration) continues to suggest that the RBNZ’s macro-prudential curbs on high risk mortgage lending and recent interest rate increases are still working.
Other indicators support this contention.
According to the REINZ, sales volumes were 2.4% lower than October 2013. In a similar vein, New Zealand housing loan approvals continue to fall, as shown below, although they do show signs of recovery:
The RBNZ supports this contention. In a Finance and Expenditure Committee select committee on Thursday, RBNZ Governor, Graeme Wheeler, noted that house prices in Auckland would have surged had it not been for the LVR speed limit:
Wheeler said Auckland’s housing market suffered supply shortages and the combination of interest rates at 50 year lows, aggressive bank lending and rising net migration had created momentum in the Auckland housing market through 2012 and 2013. The high LVR speed limit had helped to reduce Auckland’s annual house price inflation from around 17% at the time to around 8.5% now, he said…
I think we ran the real risk of a serious bubble had we not introduced these measures back in October last year. At that point house price inflation was running at 17% in Auckland. I think it would have gotten well above 20%,” Wheeler said.
Certainly, the RBNZ’s Financial Stability Report, released on Wednesday, showed a big reduction in high risk lending, along with the big fall in turnover:
The level of risk in banks’ housing loan portfolios, as measured by the proportion of high-LVR lending, has substantially reduced since the introduction of the LVR restrictions. The aggregate share of high-LVR lending relative to new housing loan commitments was 7.3 percent at the end of September (and 6.8 percent on a three-month moving average basis) – comfortably within the 10 percent ‘speed limit’ (figure 2.7). The total proportion of high-LVR mortgages in overall bank mortgage loan portfolios has fallen from over 20 percent in late 2013 to just over 16 percent in June 2014.
So while the RBNZ’s macro-prudential measures are by no means a ‘silver bullet’, they have at least mitigated house price pressures and bolstered financial stability, and should therefore be considered a success.
Leith van Onselen is Chief Economist at the MB Fund and MB Super. He is also Chief Economist and co-founder of MacroBusiness. Leith has previously worked at the Australian Treasury, Victorian Treasury and Goldman Sachs.
Latest posts by Unconventional Economist (see all)